> For the complete documentation index, see [llms.txt](https://docs.infraon.io/infinity/llms.txt). Markdown versions of documentation pages are available by appending `.md` to page URLs; this page is available as [Markdown](https://docs.infraon.io/infinity/user-guide/asset/asset-information.md).

# Asset Information

Upon adding an asset to the Infraon portal, users will be presented with a default view showcasing key details about the asset. This information is a quick reference point and can be customized later to fit specific needs.

**Asset Properties** | Details

<table data-header-hidden><thead><tr><th width="143.00006103515625"></th><th></th></tr></thead><tbody><tr><td><strong>Label</strong></td><td><strong>Description/ Example</strong></td></tr><tr><td>Asset Name</td><td>Identify the asset with a user-friendly name.</td></tr><tr><td>Asset ID</td><td>A unique identifier is assigned to the asset within the system for easy tracking and reference.</td></tr><tr><td>IP Address</td><td>View the network address associated with the asset.</td></tr><tr><td>Status</td><td>Quickly understand the asset's current operational state (e.g., Active, Inactive, or Under Maintenance).</td></tr><tr><td>Manufacturer</td><td>Identify the company that produced the hardware asset.</td></tr><tr><td>OS Version</td><td>View the operating system version installed on the asset.</td></tr><tr><td>System SKU Number</td><td>Displays the unique <strong>System Stock Keeping Unit (SKU)</strong> number fetched directly from the discovery agent. This field helps in identifying the specific hardware model and configuration provided by the manufacturer. The value is auto-populated by the inventory agent when the asset is discovered and cannot be edited manually. <br><br><strong>Example:</strong> 15AB-1234-XYZ</td></tr><tr><td><strong>Actions</strong></td><td></td></tr><tr><td>Edit</td><td>Modify any of the asset's details to ensure accuracy and reflect any changes.</td></tr><tr><td>Delete</td><td>Remove the asset from the inventory if it's no longer needed.</td></tr><tr><td>Add Owner</td><td>Assign a specific user as the asset's owner, facilitating responsibility and ownership tracking.</td></tr><tr><td>Schedule RDP</td><td>This functionality is available depending on the specific configuration. It allows users to schedule a remote desktop connection to the asset (useful for managing Windows-based devices remotely).</td></tr><tr><td>CLI Session</td><td>Initiating a CLI session connects to a network device to execute commands for tasks like configuration, diagnostics, and software updates, enabling efficient device management.</td></tr><tr><td>Add Owner</td><td>Click Add Owner to assign a user as the asset owner.<br><br>Assigns a user as the asset's owner for ownership tracking. If the assigned user is later marked inactive, they are automatically removed from the asset.<br><br>The change is reflected in the asset fields and recorded in the activity log.</td></tr><tr><td>Add User</td><td>Click Add User to assign a user to the asset.<br><br>Assigns a user as the asset user (used by). If the assigned user is marked inactive, they are automatically removed from the asset, ensuring assets remain linked only to active users.<br><br>All changes are tracked in the activity log.</td></tr></tbody></table>

## **Steps to Initiate CLI Connection**

Infraon allows administrators or technicians to initiate secure CLI (Command Line Interface) sessions directly from the **IT Assets** module for supported devices. These sessions can be used for diagnostics, configuration, or troubleshooting.

The session can be launched using **SSH** or **TELNET** protocols, and the access can be controlled through **Request-based approval** or **direct submission**, depending on role privileges.

To initiate a CLI session/ Job, follow the steps below:

* Locate the desired asset within the IT asset list.
* Click on the "More Options" menu (usually represented by three dots) and select "CLI Session.”
* A pop-up window will appear.
* On the new pop-up tab, enter the IP address, username, port, and access reason, and select the SSH or TELNET protocol.

<table data-header-hidden><thead><tr><th valign="top"></th><th valign="top"></th><th valign="top"></th></tr></thead><tbody><tr><td valign="top"><strong>Label</strong></td><td valign="top"><strong>Action</strong></td><td valign="top"><strong>Description / Example</strong></td></tr><tr><td valign="top"><strong>IP Address</strong>*</td><td valign="top">Auto-filled</td><td valign="top"><p>Displays the IP address of the selected asset. This is non-editable.</p><p> </p><p>Example: <code>10.0.4.31</code></p></td></tr><tr><td valign="top"><strong>Use Custom Username</strong></td><td valign="top">Toggle</td><td valign="top">Enable this toggle if you want to specify a custom username instead of using stored credentials.</td></tr><tr><td valign="top"><strong>Username</strong>*</td><td valign="top">Enter username</td><td valign="top">Required if "Use Custom Username" is toggled ON. Enter the username to initiate the CLI session.<br><br>Example: <code>admin</code>, <code>techuser, etc.</code></td></tr><tr><td valign="top"><strong>Port</strong>*</td><td valign="top">Enter the port number.</td><td valign="top">Specify the port to use for the session. The default for SSH is <code>22</code>, and for Telnet, it's <code>23</code>.</td></tr><tr><td valign="top"><strong>Access Reason</strong>*</td><td valign="top">Enter justification</td><td valign="top"><p>Provide an apparent reason for accessing the device. This helps with audit logging and approval context.</p><p> </p><p>Example: <code>Urgent troubleshooting - link down</code></p></td></tr><tr><td valign="top"><strong>Protocol Selection (SSH / TELNET)</strong></td><td valign="top">Click to select</td><td valign="top">Choose the preferred protocol to establish the CLI session. SSH is recommended for secure access.</td></tr><tr><td valign="top"><strong>Active Duration (Hours, Minutes)</strong>*</td><td valign="top">Select duration</td><td valign="top"><p>Specify how long the session should remain active after approval. This limits windowed access.</p><p> </p><p>Example: <code>0 Hours, 30 Minutes</code></p></td></tr><tr><td valign="top"><strong>Access Count (0 = unlimited)</strong>*</td><td valign="top">Set limit</td><td valign="top">Define how many times the user can access the session. Set to <code>0</code> for unlimited access during the session window.</td></tr><tr><td valign="top"><strong>Active Duration Begins</strong></td><td valign="top">Choose start type</td><td valign="top">Select whether the session should begin <strong>Immediately</strong> or <strong>From Approved Time</strong>.</td></tr><tr><td valign="top"><strong>Request</strong></td><td valign="top">Click to request a session.</td><td valign="top">Sends the CLI session request for approval (if pre-approval is required)—routes through the Change Management workflow.</td></tr><tr><td valign="top"><strong>Submit</strong></td><td valign="top">Click to start the session directly.</td><td valign="top">Bypasses approval (only visible for users with enough privilege). Starts session instantly.</td></tr></tbody></table>

{% hint style="info" %}

* If your role requires pre-approval, clicking **Request** will route the session for manager or admin approval.
* Once approved, the session becomes active during the defined window.
* If you have direct privileges, clicking **Submit** will initiate the CLI session instantly without approval.
* All actions are logged for audit, and access is time-bound and usage-controlled to maintain compliance and security.
  {% endhint %}

## Instructions to Schedule RDP <a href="#toc174553134" id="toc174553134"></a>

* Locate the desired asset within the IT asset list.
* Click on the "More Options" menu (usually represented by three dots) and select "Schedule RDP."
* A pop-up window will appear. Choose the date, time, and desired duration (in minutes) for your RDP session.
* Click the "Schedule" button to save your configuration.
* Once scheduled, a "Session is Active" icon will appear on the IT asset within the list. Click on this icon to securely launch the remote desktop connection.

## Sections

From the Asset grid page, filter the category SDH / PDH; on the filtered grid page, click on the Device Name or IP to view additional information. There are multiple sub-views with all the necessary information about the device. These are: &#x20;

### Details  <a href="#toc174553135" id="toc174553135"></a>

Inventory information includes basic details, additional properties, Custom Fields, and Health Summary.&#x20;

The following section breaks down the details:&#x20;

* Device Details&#x20;
* Hostname&#x20;
* Device Type&#x20;
* Tags (Click on ‘Edit’ to add or remove the tags)&#x20;
* Asset ID&#x20;
* Device Type&#x20;
* IP Address&#x20;
* Make&#x20;
* Active Version&#x20;
* Ci Name&#x20;
* Managed EMS IP&#x20;
* Managed EMS Name&#x20;
* Model&#x20;
* Owner Details&#x20;
* Name&#x20;
* Mail ID&#x20;
* Mobile number&#x20;
* Edit – Click to make changes.&#x20;
* User Details&#x20;
* Name&#x20;
* Mail ID&#x20;
* Edit – Click to make changes.&#x20;
* Deallocate – Click to allocate a new user.&#x20;
* Resend Email – Click to resend the e-mail.&#x20;
* Attachment &#x20;
* Choose from the categories (Default, Procurement, Service, Retirement Documents).&#x20;
* Add – Click to add new attachments.&#x20;
* Asset Configuration&#x20;
* Creation Time&#x20;
* Last Update Time&#x20;
* Login Profile&#x20;
* Login Profile ID&#x20;

#### **User Logins/Logouts**

Audit the user login and logout entries within the asset management module. This allows IT administrators to identify which users have accessed specific IT assets (laptops, desktops) and when. This information can help troubleshoot access issues, monitor asset usage, and maintain security compliance.

The inventory agent gathers data on login and logout activity for each asset at regular intervals (inventory updates) and presents this data within the user logins and logouts module.

#### **What you see on the screen**

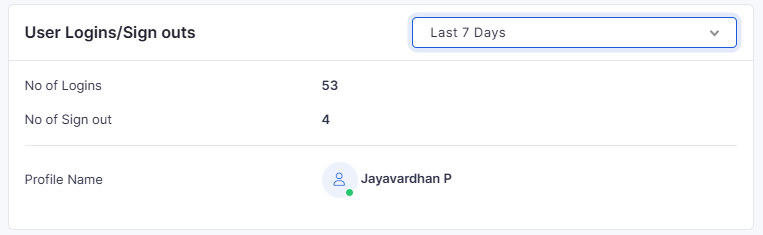
The asset details page displays a user login and logout cart. This module details the profile name, number of logins, and number of logouts associated with each user profile for the selected asset. Additionally, a date filter allows technicians to refine the displayed data for a specific timeframe.

<figure><img src="https://content.gitbook.com/content/HOkWBaqDGJVTArkIQTsj/blobs/73ZfUiUKLUCUnNSm82tm/image.png" alt=""><figcaption></figcaption></figure>

| **Label**     | **Description/ Example**                                                                                 |
| ------------- | -------------------------------------------------------------------------------------------------------- |
| No of Logins  | Displays the total number of times a user profile has accessed this specific IT asset.                   |
| No of Logouts | Displays the number of times a user profile has ended a session on the IT asset.                         |
| Profile Name  | This will typically be the user's network login name or alias.                                           |
| Filter        | The date filtering function allows technicians to narrow down the displayed data to a desired timeframe. |

### Asset Lifecycle  <a href="#toc174553136" id="toc174553136"></a>

The following section breaks down the details:&#x20;

* Asset History: Track an asset's entire journey, from initial purchase through use, maintenance, and eventual disposal.&#x20;
* Purchase Order Details: View crucial information from the purchase order, including the date, cost, supplier, and specifications.&#x20;
* Annual Maintenance Contract (AMC): Monitor active AMCs associated with the asset, displaying coverage period, service provider, and key terms.&#x20;
* Warranty Information: Access comprehensive warranty details like start/end dates, covered components, and claims history.&#x20;

### Panel View  <a href="#toc174553137" id="toc174553137"></a>

Displays graphical view of a node with all inventory information including shelf, slot, card and port. Port information includes status of port, port utilization and other details.&#x20;

The following section breaks down the details:&#x20;

* Service State&#x20;
* Serial Number&#x20;
* Vendor&#x20;
* Name&#x20;
* Type&#x20;
* Location&#x20;
* Capacity&#x20;
* Layer Rate&#x20;
* SFP (Small Form Factor) Type&#x20;
* Vendor&#x20;
* SFP Status&#x20;
* SFP Serial Number&#x20;
* SFP Product Code&#x20;
* Loopback Mode&#x20;
* Transmitted Trace&#x20;
* Received Trace&#x20;
* PTP (Port of Tanjung Pelepas)&#x20;
* SFP Installed Version&#x20;
* IP Address&#x20;
* MTU (Maximum Transmission Unit)&#x20;
* PTP (Port of Tanjung Pelepas)&#x20;
* PVID&#x20;

### Inventory Tree  <a href="#toc174553138" id="toc174553138"></a>

Displays the list of inventories and parts of the device, such as rack / shelf / slot / card / port / SFP details. Click on a specific inventory to view its properties. The inventory includes Shelves, Slots, Cards, and ports. On click of each port, it will show port information, for example: Port Status, Optical values of Port, etc.&#x20;

The following section breaks down the property details:&#x20;

* Name&#x20;
* IP Address&#x20;
* Host Name&#x20;
* Type&#x20;
* Card Name&#x20;
* Component Type&#x20;
* Serial Number&#x20;
* Part Number&#x20;
* Physical Status&#x20;
* Service State&#x20;

### Software <a href="#hlk171605907" id="hlk171605907"></a>

Displays detailed information about the software, including the software name, version, and license details, such as whether the license is purchased or subscription-based and its expiration date.

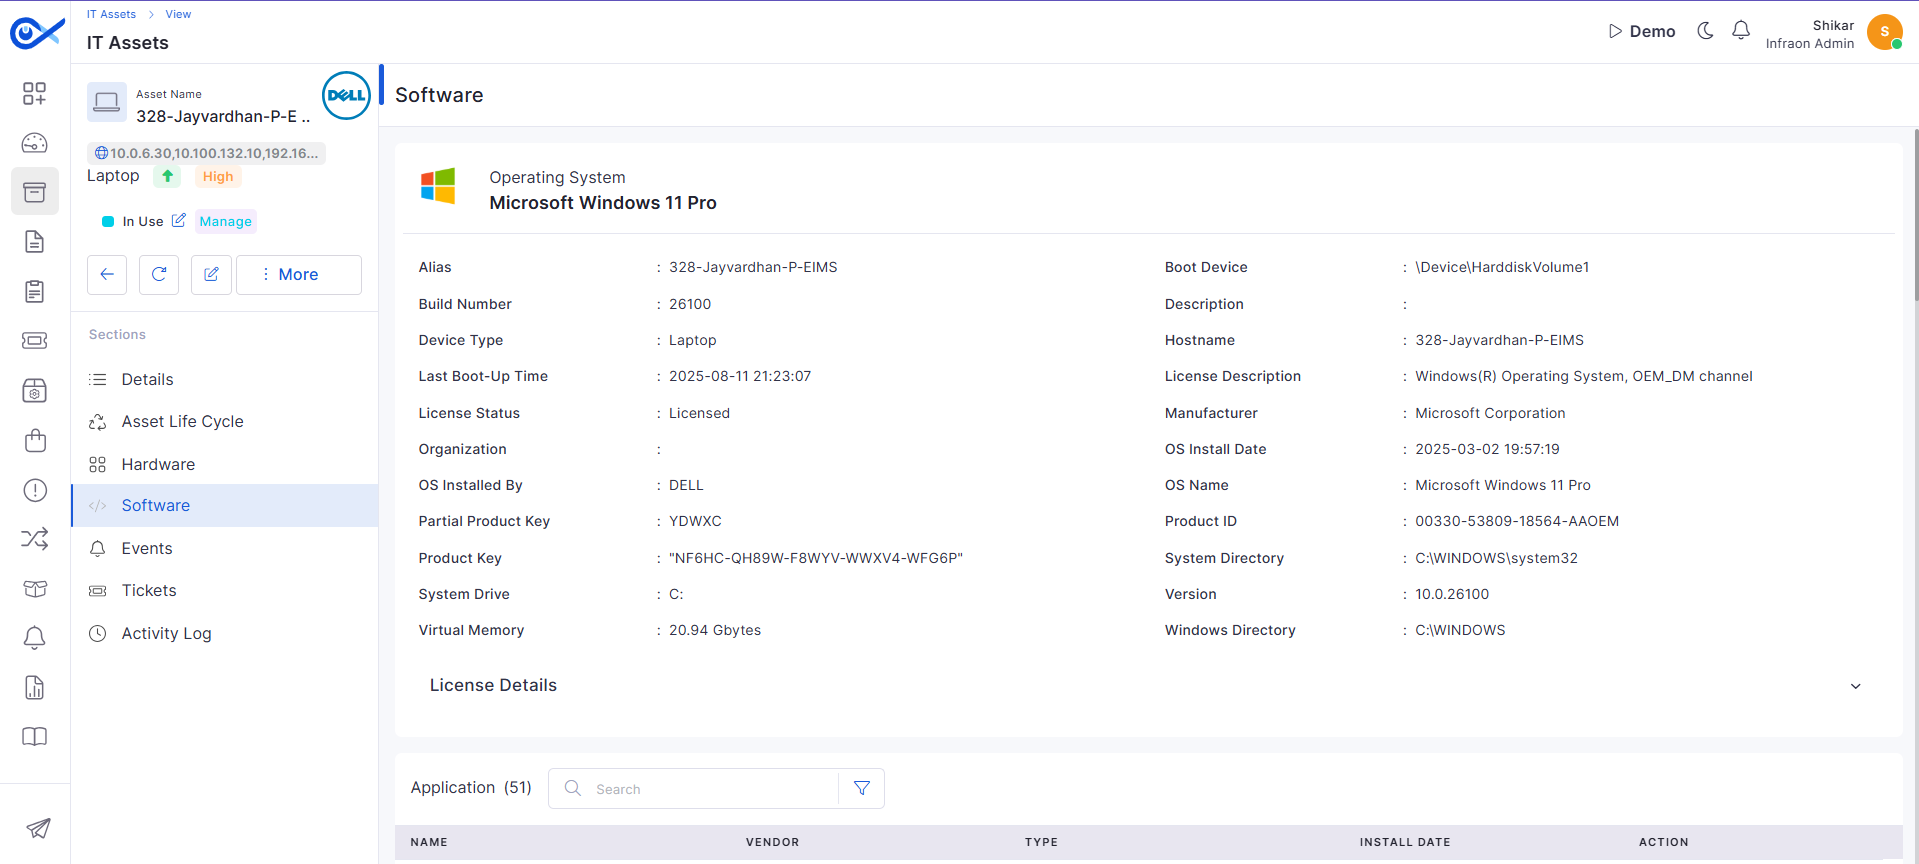
This section provides detailed OS-level and system metadata for the selected asset.

<figure><img src="https://content.gitbook.com/content/HOkWBaqDGJVTArkIQTsj/blobs/UDAhtMm5R16UuQmfRSPo/image.png" alt=""><figcaption></figcaption></figure>

#### Operating System Details

<table data-header-hidden><thead><tr><th valign="top"></th><th valign="top"></th><th valign="top"></th></tr></thead><tbody><tr><td valign="top"><strong>Label</strong></td><td valign="top"><strong>Description</strong></td><td valign="top"><strong>Example</strong></td></tr><tr><td valign="top"><strong>Alias</strong></td><td valign="top">A custom label or nickname assigned to the asset (if configured)</td><td valign="top">EIMS-Laptop-BGLR</td></tr><tr><td valign="top"><strong>Build Number</strong></td><td valign="top">The Windows OS build number, indicating the system's software version level</td><td valign="top">22631</td></tr><tr><td valign="top"><strong>Device Type</strong></td><td valign="top">Indicates whether the asset is a laptop, desktop, virtual machine, or other type of device.</td><td valign="top">Laptop</td></tr><tr><td valign="top"><strong>Last Boot-Up Time</strong></td><td valign="top">Date and time when the asset was last restarted</td><td valign="top">2024-07-01 11:05:35</td></tr><tr><td valign="top"><strong>Organization</strong></td><td valign="top">The name of the owning organization as registered in the platform</td><td valign="top">LENOVO</td></tr><tr><td valign="top"><strong>OS Installed By</strong></td><td valign="top">Name of the user or technician who installed the OS</td><td valign="top">LENOVO</td></tr><tr><td valign="top"><strong>Product ID</strong></td><td valign="top">The Windows product ID is assigned to the OS</td><td valign="top">00330-80000-00000-AA121</td></tr><tr><td valign="top"><strong>System Directory</strong></td><td valign="top">The directory path of the operating system's system files</td><td valign="top">C:\WINDOWS\system32</td></tr><tr><td valign="top"><strong>Version</strong></td><td valign="top">The full version of the installed operating system</td><td valign="top">10.0.22631</td></tr><tr><td valign="top"><strong>Windows Directory</strong></td><td valign="top">The root directory of the Windows OS installation</td><td valign="top">C:\WINDOWS</td></tr><tr><td valign="top"><strong>Boot Device</strong></td><td valign="top">The primary drive used to boot the operating system</td><td valign="top">C:</td></tr><tr><td valign="top"><strong>Description</strong></td><td valign="top">Optional admin-entered notes or metadata about the asset</td><td valign="top">Windows 11 machine for R&#x26;D</td></tr><tr><td valign="top"><strong>Hostname</strong></td><td valign="top">The network name assigned to the asset</td><td valign="top">093-Nithin-EIMS</td></tr><tr><td valign="top"><strong>Manufacturer</strong></td><td valign="top">Hardware manufacturer of the device</td><td valign="top">Microsoft Corporation</td></tr><tr><td valign="top"><strong>OS Install Date</strong></td><td valign="top">Date and time the operating system was installed</td><td valign="top">2023-07-17 11:02:03</td></tr><tr><td valign="top"><strong>OS Name</strong></td><td valign="top">Full name of the operating system</td><td valign="top">Microsoft Windows 11 Pro</td></tr><tr><td valign="top"><strong>Product Key</strong></td><td valign="top">Unique license key used to activate the Windows OS</td><td valign="top">TY4GC-JDJH7-VJ2WF-DY4X9-HCFC6</td></tr><tr><td valign="top"><strong>System Drive</strong></td><td valign="top">Drive where the OS is installed</td><td valign="top">C:</td></tr><tr><td valign="top"><strong>Virtual Memory</strong></td><td valign="top">Total amount of virtual memory available to the system</td><td valign="top">23.33 Gbytes</td></tr></tbody></table>

{% hint style="info" %}
The platform agent automatically fetches these fields from the device.
{% endhint %}

#### Application (Installed Software)

This section displays a complete list of applications installed on the selected asset. Users can view details, perform quick searches, or apply filters based on various fields.

<table data-header-hidden><thead><tr><th valign="top"></th><th valign="top"></th><th valign="top"></th></tr></thead><tbody><tr><td valign="top"><strong>Label</strong></td><td valign="top"><strong>Action</strong></td><td valign="top"><strong>Description / Example</strong></td></tr><tr><td valign="top"><strong>Search</strong></td><td valign="top">Type at least three characters to perform a search</td><td valign="top">Performs a global keyword search across application name, vendor, and type fields.</td></tr><tr><td valign="top"><strong>Filter</strong></td><td valign="top">Select a field → Choose a condition → Enter a value</td><td valign="top">Applies field-specific filters. Supported<br>Fields: <strong>Name, Type, Vendor, Version</strong>. Conditions: <code>equal to</code>, <code>not equal to</code>, <code>contains</code>, <code>not contain</code>, <code>in</code>, <code>not in</code>.</td></tr><tr><td valign="top"><strong>Name</strong></td><td valign="top">View only</td><td valign="top"><p>Displays the name of the installed application.</p><p> </p><p>Example: <em>Cisco Webex Meetings</em></p></td></tr><tr><td valign="top"><strong>Vendor</strong></td><td valign="top">View only</td><td valign="top">Displays the software vendor/publisher.<br><br>Example: <em>Fortinet Technologies Inc</em></td></tr><tr><td valign="top"><strong>Type</strong></td><td valign="top">View only</td><td valign="top"><p>Indicates the software type.</p><p> </p><p>Example: <em>Other</em></p></td></tr><tr><td valign="top"><strong>Version</strong></td><td valign="top">View only</td><td valign="top"><p>Displays the installed version number.</p><p> </p><p>Example: <code>7.0.0.9493</code></p></td></tr><tr><td valign="top"><strong>Install Date</strong></td><td valign="top">View only</td><td valign="top"><p>Shows the installation date of the application.</p><p> </p><p>Example: <code>2023-11-07</code></p></td></tr><tr><td valign="top"><strong>Action</strong></td><td valign="top">Click the delete icon to remove the application</td><td valign="top">Manually deletes the software record from the asset, typically used for incorrect or outdated entries.</td></tr></tbody></table>

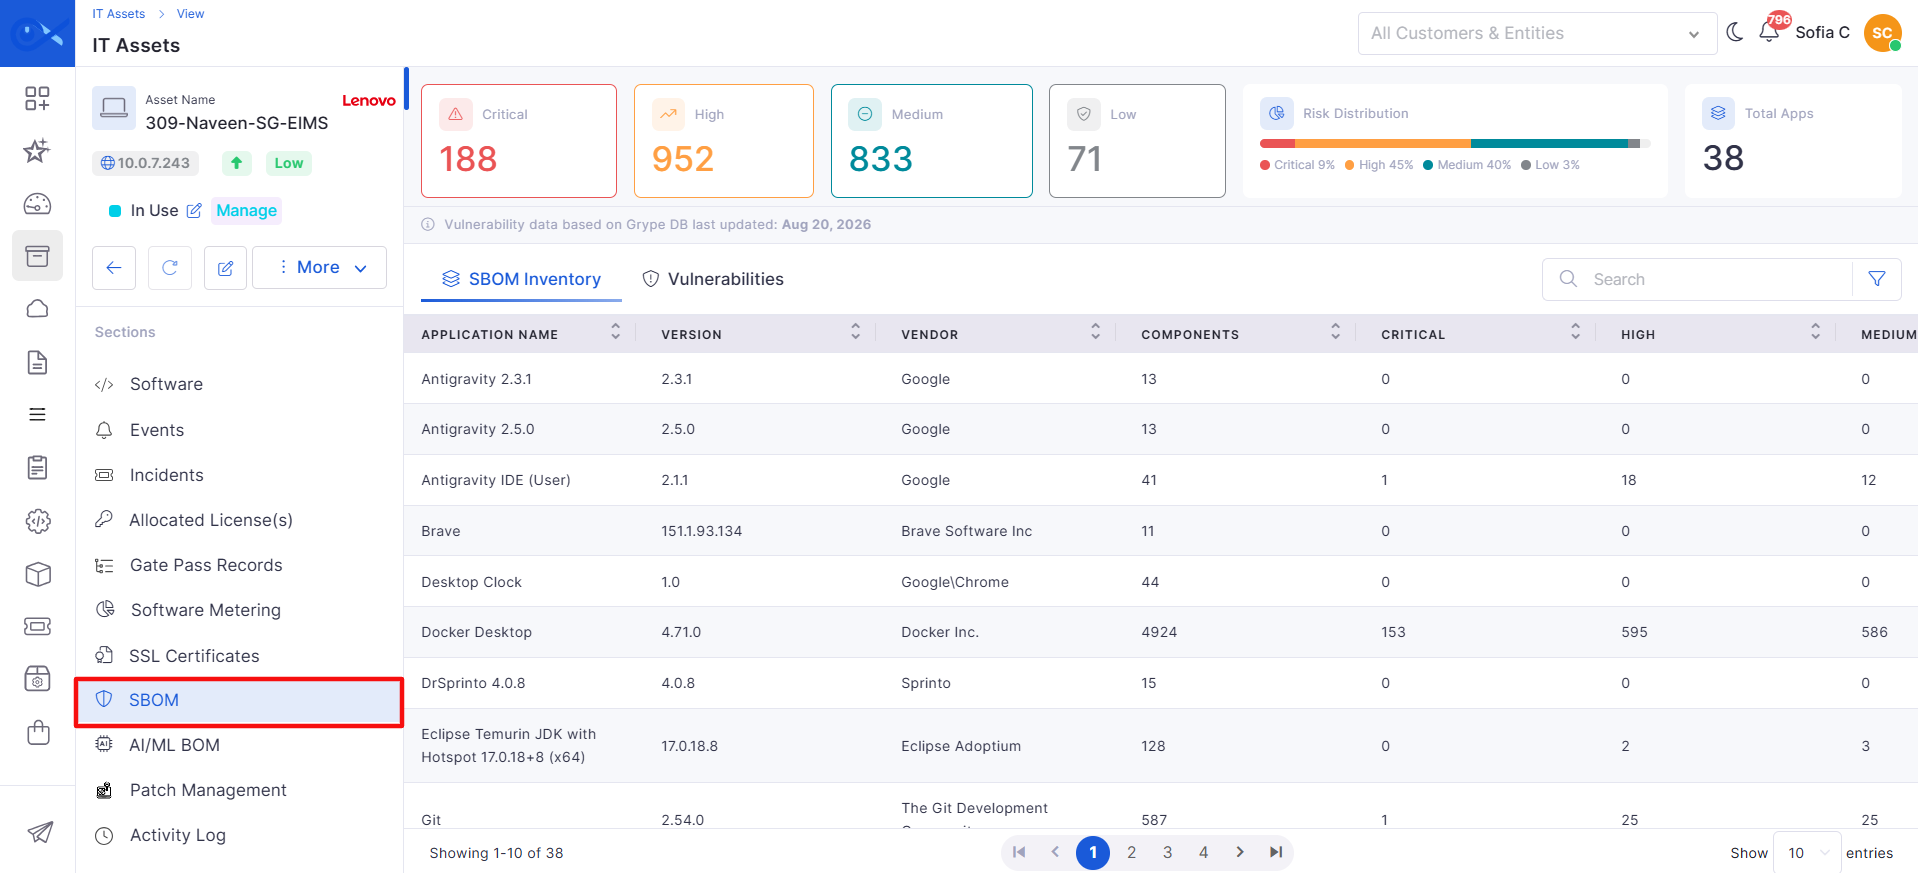
### SBOM

**SBOM** provides a consolidated view of applications, software components, assets, and vulnerability information, enabling users to review software composition and assess associated risks.

SBOM **| Top Panel Details**

<table><thead><tr><th width="124" valign="top">Label</th><th width="123.60003662109375" valign="top">Action</th><th valign="top">Description / Example</th></tr></thead><tbody><tr><td valign="top"><strong>Critical</strong></td><td valign="top">View</td><td valign="top">Displays the total number of <strong>Critical</strong> vulnerabilities identified across the scanned assets.</td></tr><tr><td valign="top"><strong>High</strong></td><td valign="top">View</td><td valign="top">Displays the total number of <strong>High</strong> vulnerabilities identified across the scanned assets.</td></tr><tr><td valign="top"><strong>Medium</strong></td><td valign="top">View</td><td valign="top">Displays the total number of <strong>Medium</strong> vulnerabilities identified across the scanned assets.</td></tr><tr><td valign="top"><strong>Low</strong></td><td valign="top">View</td><td valign="top">Displays the total number of <strong>Low</strong> vulnerabilities identified across the scanned assets.</td></tr><tr><td valign="top"><strong>Risk Distribution</strong></td><td valign="top">View</td><td valign="top">Displays a stacked bar chart representing the distribution of vulnerabilities across different severity levels.</td></tr><tr><td valign="top"><strong>Total Apps</strong></td><td valign="top">View</td><td valign="top">Displays the total number of distinct applications identified across the scanned assets.</td></tr><tr><td valign="top"><strong>Total Assets</strong></td><td valign="top">View</td><td valign="top">Displays the total number of assets that have been scanned.</td></tr></tbody></table>

#### SBOM Inventory

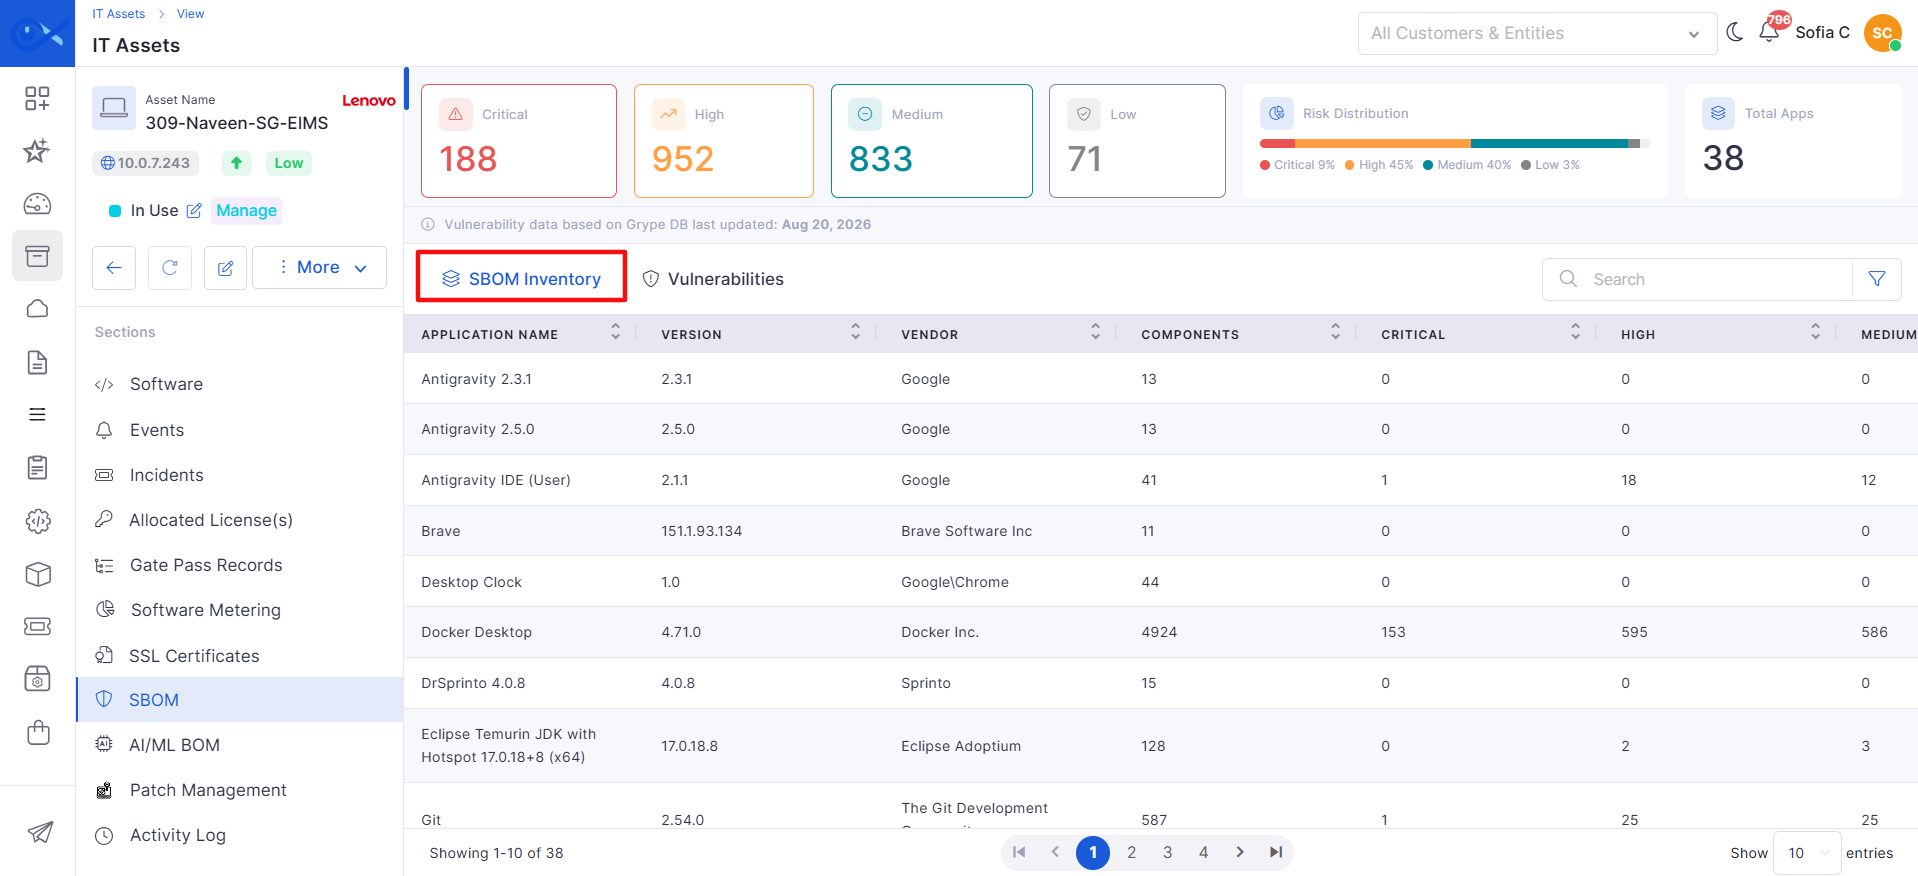
**Software Bill of Materials (SBOM)** provides an inventory of the software applications, components, and dependencies identified across assets. It helps users understand what software is installed, which components are associated with each application, and the vulnerabilities identified in those components. The SBOM data is presented at the organization level in the SBOM module.

<figure><img src="https://content.gitbook.com/content/HOkWBaqDGJVTArkIQTsj/blobs/0txAI88yaimvZ47hN6Ci/Add%20Agent%20Control%20Policy%20-%20Screenshot%2001.png" alt=""><figcaption></figcaption></figure>

**How does SBOM work?**

SBOM data is collected from scanned assets and used to identify applications and their associated software components and vulnerabilities. For example, if an asset has **7-Zip** installed, the SBOM inventory can show the application, its version and vendor, the components or dependencies associated with it, and the vulnerabilities identified for those components. Users can then select the application to view its detailed information.

**What do you see on the screen?**

When you open the **SBOM** module, the **SBOM Inventory** page is displayed. The page contains summary cards at the top, followed by the inventory table. The left navigation also provides access to **Inventory** and **Vulnerabilities**.

<figure><img src="https://content.gitbook.com/content/HOkWBaqDGJVTArkIQTsj/blobs/Dxx1qORH7dQyQhWxND3q/Configuration%20-%20Screenshot%2002.png" alt=""><figcaption></figcaption></figure>

**Basic Details**

<table><thead><tr><th width="147.20001220703125">Label</th><th width="146.79998779296875">Action</th><th>Description/Example</th></tr></thead><tbody><tr><td><strong>Search</strong></td><td>Search</td><td>Allows users to search the inventory using a keyword.</td></tr><tr><td><strong>Filter</strong></td><td>Filter</td><td>Allows users to refine the inventory results using <strong>Field, Condition,</strong> and <strong>Value</strong>.</td></tr><tr><td><strong>Field</strong></td><td>Select</td><td>Select the inventory field on which the filter should be applied.</td></tr><tr><td><strong>Condition</strong></td><td>Select</td><td>Select the required condition to determine how the field should be matched.</td></tr><tr><td><strong>Value</strong></td><td>Enter/Select</td><td>Enter or select the value to be matched against the selected field and condition.</td></tr></tbody></table>

**Column Details**

The inventory table provides application, asset, component, vulnerability, and scan information, allowing users to identify the software installed across scanned assets.

<table><thead><tr><th width="167.199951171875" valign="top">Label</th><th width="125.60003662109375" valign="top">Action</th><th valign="top">Description/Example</th></tr></thead><tbody><tr><td valign="top"><strong>Application Name</strong></td><td valign="top">View</td><td valign="top"><p>Displays the name of the application identified in the SBOM data. </p><p></p><p><strong>Example</strong>: Google Chrome</p></td></tr><tr><td valign="top"><strong>Version</strong></td><td valign="top">View</td><td valign="top"><p>Displays the version of the application. </p><p></p><p><strong>Example</strong>: 124.0.6367.91</p></td></tr><tr><td valign="top"><strong>Vendor</strong></td><td valign="top">View</td><td valign="top"><p>Displays the vendor associated with the application. </p><p></p><p><strong>Example</strong>: Google LLC</p></td></tr><tr><td valign="top"><strong>Hostname</strong></td><td valign="top">View</td><td valign="top"><p>Displays the hostname of the asset where the application was identified. </p><p></p><p><strong>Example</strong>: workstation-01</p></td></tr><tr><td valign="top"><strong>IP Address</strong></td><td valign="top">View</td><td valign="top"><p>Displays the IP address associated with the host. </p><p></p><p><strong>Example</strong>: 192.168.1.50</p></td></tr><tr><td valign="top"><strong>Components</strong></td><td valign="top">View</td><td valign="top"><p>Displays the number of software components or dependencies identified for the application. </p><p></p><p><strong>Example</strong>: 312</p></td></tr><tr><td valign="top"><strong>Critical</strong></td><td valign="top">View</td><td valign="top">Displays the number of Critical vulnerabilities associated with the application.</td></tr><tr><td valign="top"><strong>High</strong></td><td valign="top">View</td><td valign="top">Displays the number of High vulnerabilities associated with the application.</td></tr><tr><td valign="top"><strong>Last Scanned</strong></td><td valign="top">View</td><td valign="top">Displays the date and time when the application was last scanned.</td></tr><tr><td valign="top"><strong>Actions</strong></td><td valign="top">Perform action</td><td valign="top">Provides actions to view inventory details, view components, and download the SBOM for the selected application.</td></tr></tbody></table>

**Column Details: Action Icons**

<table><thead><tr><th width="173.5999755859375" valign="top">Label</th><th width="130.20001220703125" valign="top">Action</th><th valign="top">Description/Example</th></tr></thead><tbody><tr><td valign="top"><strong>View</strong></td><td valign="top">View</td><td valign="top"><p>Opens the <strong>SBOM Inventory Detail</strong> sidebar for the selected application. </p><p></p><p>The sidebar provides application details, host information, scan information, vulnerability summary, and the associated CVE list.</p></td></tr><tr><td valign="top"><strong>View Components</strong></td><td valign="top">Navigate</td><td valign="top">Navigates to the <strong>Components</strong> page for the selected application, where users can view the identified components and switch between the available All and Application views and different display modes.</td></tr></tbody></table>

**SBOM Inventory Detail**

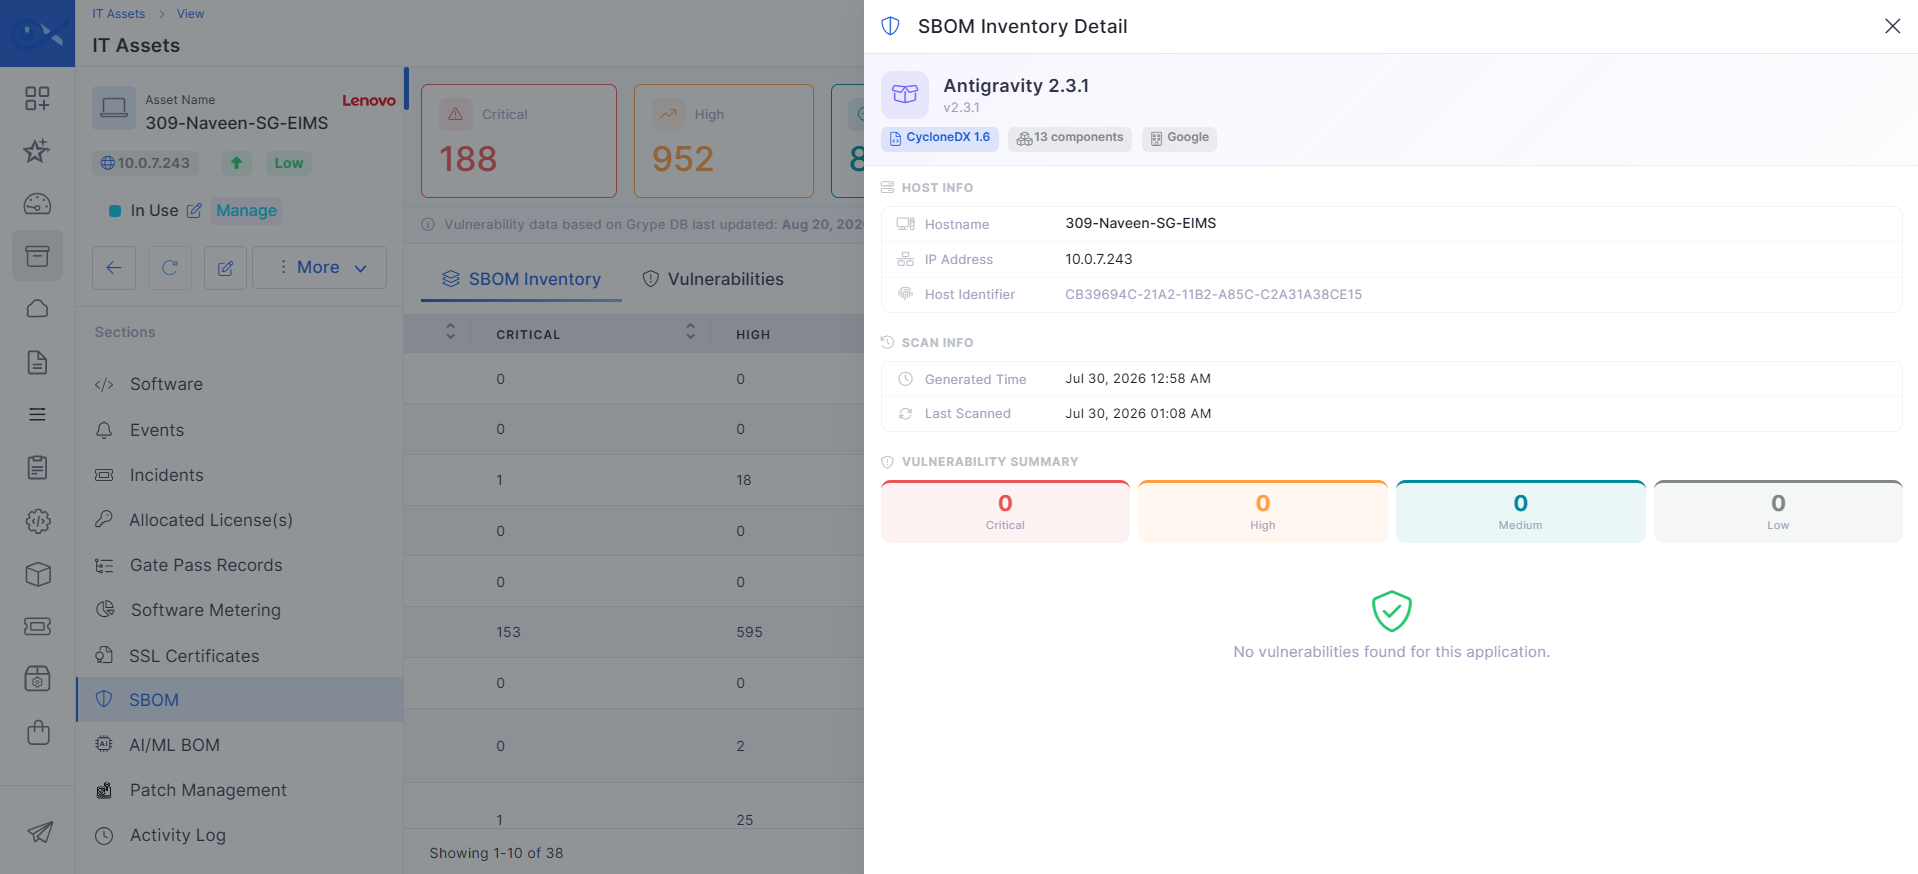
When **View** is selected, the **SBOM Inventory Detail** sidebar opens on the right and provides detailed information about the selected application, its host, scan details, and associated vulnerabilities.

<figure><img src="https://content.gitbook.com/content/HOkWBaqDGJVTArkIQTsj/blobs/bHOZaAS4txOHeHdH20KU/Configurations%20-%20Screenshot%2001.png" alt=""><figcaption></figcaption></figure>

<table><thead><tr><th width="203.20001220703125">Label</th><th width="95.5999755859375">Action</th><th>Description/Example</th></tr></thead><tbody><tr><td><strong>Application Details</strong></td><td>View</td><td>Displays the application <strong>Version, SBOM Format, Components</strong>, and <strong>Vendor</strong>.</td></tr><tr><td><strong>Host Info</strong></td><td>View</td><td>Displays <strong>the Hostname, IP Address</strong>, and <strong>Host ID</strong> associated with the application.</td></tr><tr><td><strong>Scan Info</strong></td><td>View</td><td>Displays the <strong>Generated Time</strong> and <strong>Last Scanned Time.</strong></td></tr><tr><td><strong>Vulnerability Summary</strong></td><td>View</td><td>Displays the <strong>Critical, High, Medium</strong>, and <strong>Low</strong> vulnerability counts for the application.</td></tr><tr><td><strong>CVE List</strong></td><td>View</td><td>Displays the CVEs identified for the application along with their severity information.</td></tr></tbody></table>

**Components**

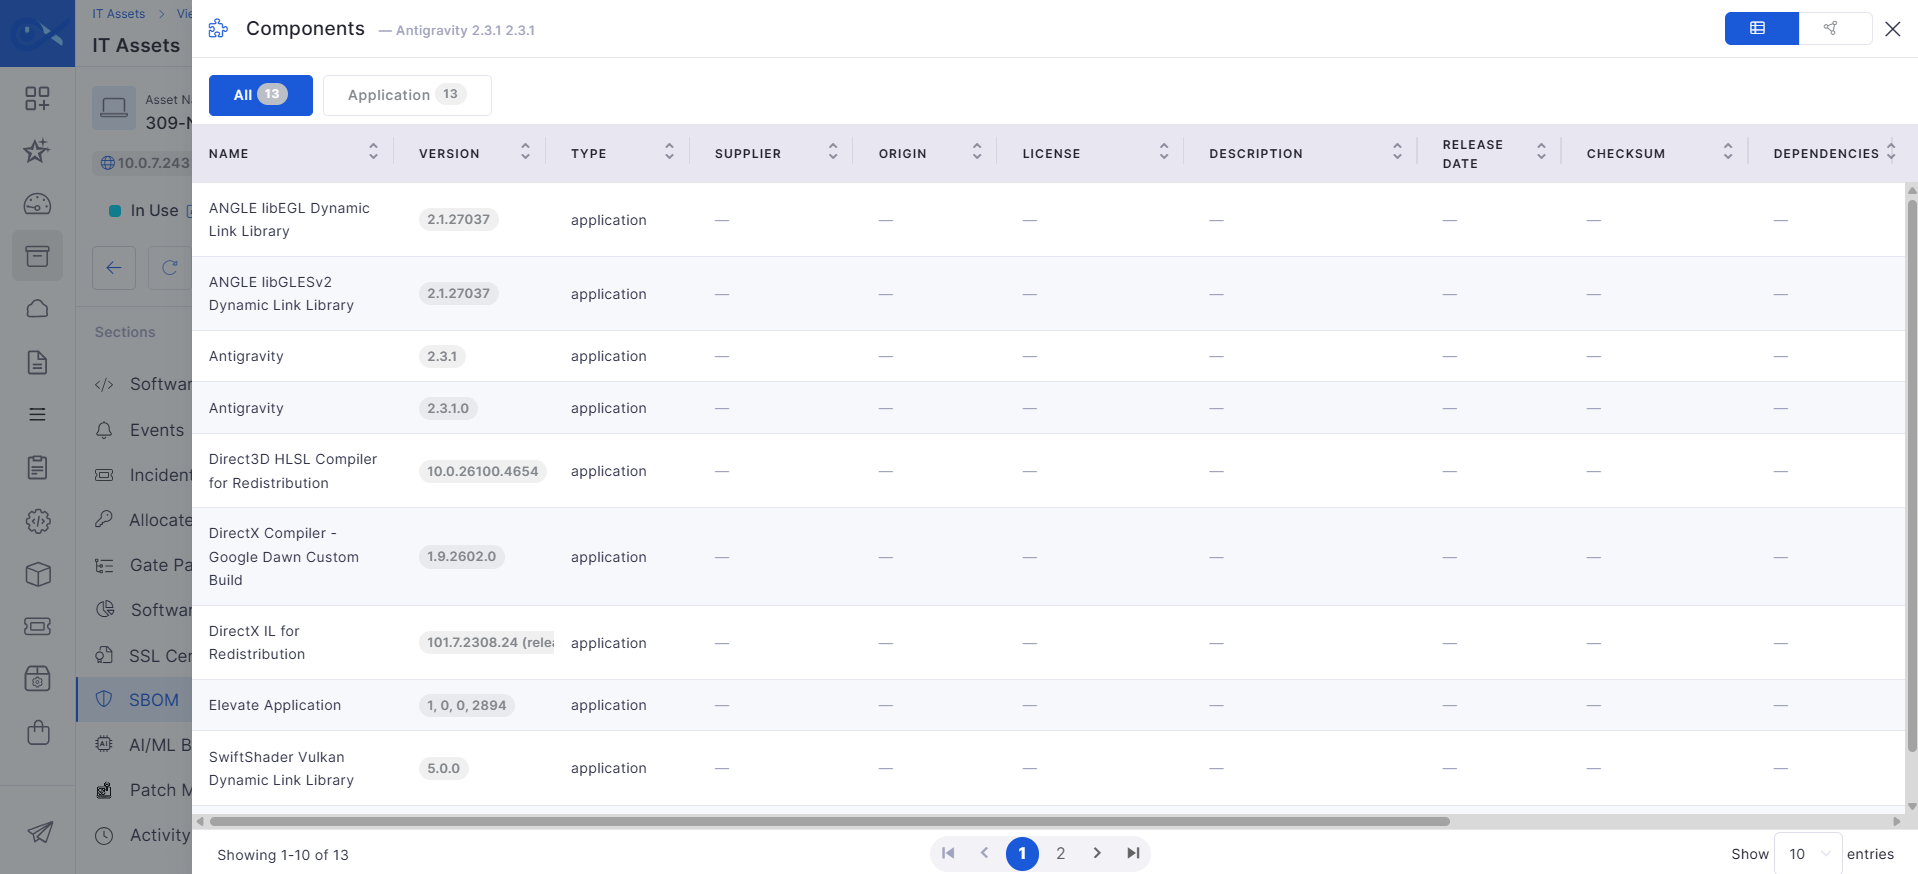
When **View Components** is selected for an application, the **Components** page opens and displays the software components and dependencies associated with the selected application. Users can switch between **All** and **Application** views and choose either **Grid View** or **Graph View** to examine the component information.

<figure><img src="https://content.gitbook.com/content/HOkWBaqDGJVTArkIQTsj/blobs/WiD6YtIwcnRB9YGU552I/Agent%20Details%20-%20Screenshot%2001.png" alt=""><figcaption></figcaption></figure>

**Component Details**

The component details provide information about the component, its source, licensing, dependencies, and other SBOM metadata.

<table><thead><tr><th width="142.40008544921875">Label</th><th width="119">Action</th><th>Description/Example</th></tr></thead><tbody><tr><td><strong>All</strong></td><td>Select</td><td>Displays all components available for the selected SBOM inventory record, including associated dependencies.</td></tr><tr><td><strong>Application</strong></td><td>Select</td><td>Displays components associated specifically with the selected application.</td></tr><tr><td><strong>Version</strong></td><td>View</td><td><p>Displays the version of the component. </p><p></p><p><strong>Example</strong>: 1.1.1</p></td></tr><tr><td><strong>Type</strong></td><td>View</td><td>Displays the type of software component.</td></tr><tr><td><strong>Supplier</strong></td><td>View</td><td>Displays the supplier or organization that provides the component.</td></tr><tr><td><strong>Origin</strong></td><td>View</td><td>Displays the origin or source from which the component was obtained.</td></tr><tr><td><strong>License</strong></td><td>View</td><td>Displays the license associated with the component.</td></tr><tr><td><strong>Description</strong></td><td>View</td><td>Displays a description of the software component and its purpose.</td></tr><tr><td><strong>Release Date</strong></td><td>View</td><td>Displays the release date of the component version.</td></tr><tr><td><strong>Checksum</strong></td><td>View</td><td>Displays the checksum associated with the component for identification or integrity verification.</td></tr><tr><td><strong>Dependencies</strong></td><td>View</td><td>Displays the dependencies associated with the component.</td></tr><tr><td><strong>Properties</strong></td><td>View</td><td>Displays additional properties or metadata associated with the component.</td></tr><tr><td><strong>Notes</strong></td><td>View</td><td>Displays additional notes or information provided for the component.</td></tr><tr><td><strong>Package URL (PURL)</strong></td><td>View</td><td>Displays the Package URL (PURL) that uniquely identifies the software package.</td></tr><tr><td><strong>Grid View</strong></td><td>Select</td><td>Displays component information in a structured grid/table format, allowing users to view the available component details in columns.</td></tr><tr><td><strong>Graph View</strong></td><td>Select</td><td>Displays the components and their relationships in a graphical representation, making it easier to understand component and dependency relationships.</td></tr></tbody></table>

#### Vulnerability

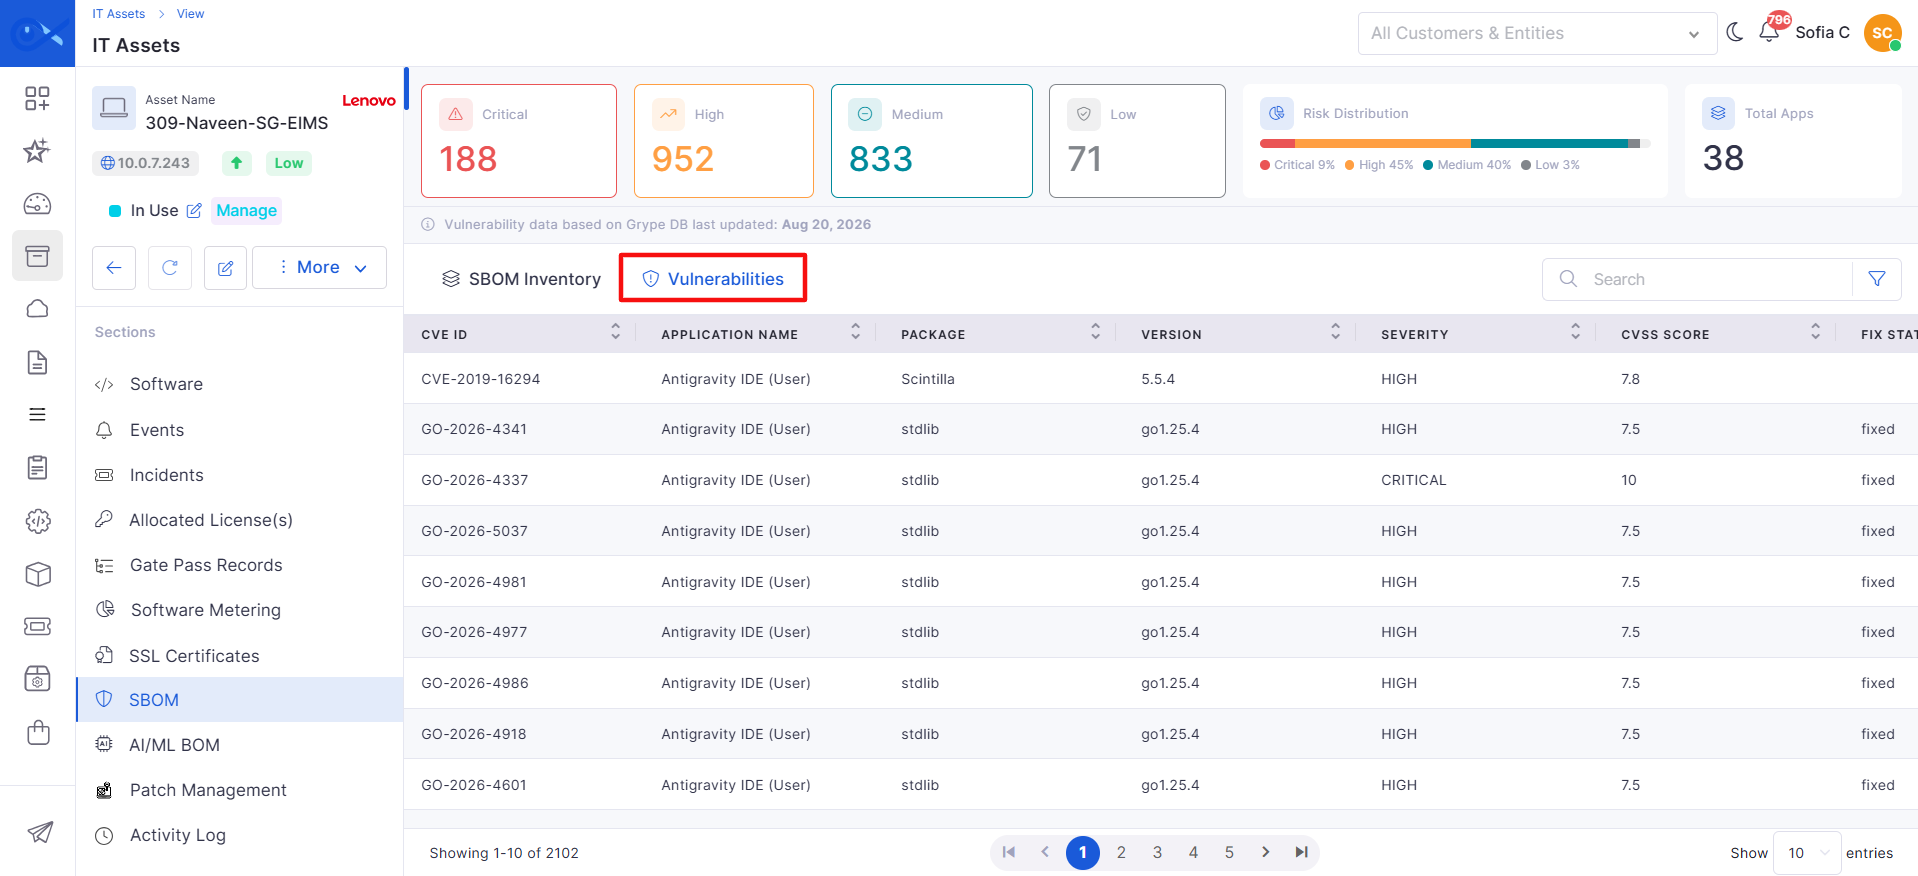
**SBOM Vulnerabilities** provides a centralized view of vulnerabilities identified across the software components and applications discovered in scanned assets. It helps users review vulnerability severity, CVSS scores, fix states, affected packages, and scan information to support vulnerability assessment and remediation.

<figure><img src="https://content.gitbook.com/content/HOkWBaqDGJVTArkIQTsj/blobs/GxHUsQPypTLRGz9ghgPr/Column%20Details%20-%20Screenshot%2003.png" alt=""><figcaption></figcaption></figure>

**How does Vulnerability work?**

Vulnerabilities are identified from the software components recorded in the SBOM data of scanned assets. The identified CVEs are consolidated in the **Vulnerabilities** page, where users can review the vulnerability details and prioritize them based on severity and fix state.

{% hint style="info" %}
**Use case:**&#x20;

For example, if **OpenSSL 1.1.1** is installed on an asset and a vulnerability such as **CVE-2024-1234** is identified, the Vulnerabilities page displays the CVE, affected application and package, severity, CVSS score, fix state, and scan time. Users can select **View** to open the detailed vulnerability information.
{% endhint %}

The SBOM Vulnerability table is documented with the columns **CVE ID, Application Name, Package, Version, Severity, CVSS Score, Fix State, Scan Time,** and **Actions**.

**What do you see on the screen?**

When you open **SBOM > Vulnerabilities**, the **SBOM Vulnerabilities** page is displayed. The page provides an overview of the identified vulnerabilities followed by the vulnerability inventory table. Users can review vulnerability information and select the available action to view detailed information about a specific vulnerability.

**Column Details**

The vulnerability table provides detailed information about each identified CVE, including the affected application and package, vulnerability severity, CVSS score, fix state, and scan information.

<table><thead><tr><th width="165.5999755859375" valign="top">Label</th><th width="122.5999755859375" valign="top">Action</th><th valign="top">Description/Example</th></tr></thead><tbody><tr><td valign="top"><strong>CVE ID</strong></td><td valign="top">View</td><td valign="top"><p>Displays the unique identifier of the vulnerability. </p><p></p><p><strong>Example</strong>: CVE-2024-1234</p></td></tr><tr><td valign="top"><strong>Application Name</strong></td><td valign="top">View</td><td valign="top"><p>Displays the application associated with the vulnerability. </p><p></p><p><strong>Example</strong>: Google Chrome</p></td></tr><tr><td valign="top"><strong>Package</strong></td><td valign="top">View</td><td valign="top"><p>Displays the software package affected by the vulnerability. </p><p></p><p><strong>Example</strong>: openssl</p></td></tr><tr><td valign="top"><strong>Version</strong></td><td valign="top">View</td><td valign="top"><p>Displays the version of the affected package. </p><p></p><p><strong>Example</strong>: 1.1.1</p></td></tr><tr><td valign="top"><strong>Severity</strong></td><td valign="top">View</td><td valign="top"><p>Displays the severity level of the vulnerability. </p><p></p><p><strong>Example</strong>: Critical, High, Medium, or Low</p></td></tr><tr><td valign="top"><strong>CVSS Score</strong></td><td valign="top">View</td><td valign="top"><p>Displays the Common Vulnerability Scoring System (CVSS) score assigned to the vulnerability. </p><p></p><p><strong>Example</strong>: 8.1</p></td></tr><tr><td valign="top"><strong>Fix State</strong></td><td valign="top">View</td><td valign="top"><p>Displays the current fix status of the vulnerability. </p><p></p><p><strong>Example</strong>: Fixed / Unfixed</p></td></tr><tr><td valign="top"><strong>Scan Time</strong></td><td valign="top">View</td><td valign="top">Displays the date and time when the vulnerability was identified during the scan.</td></tr><tr><td valign="top"><strong>Actions</strong></td><td valign="top">Perform action</td><td valign="top">Provides actions available for the selected vulnerability, such as viewing its detailed information.</td></tr></tbody></table>

**Action Icons**

The **Actions** column allows users to open the detailed information of a selected vulnerability for further investigation.

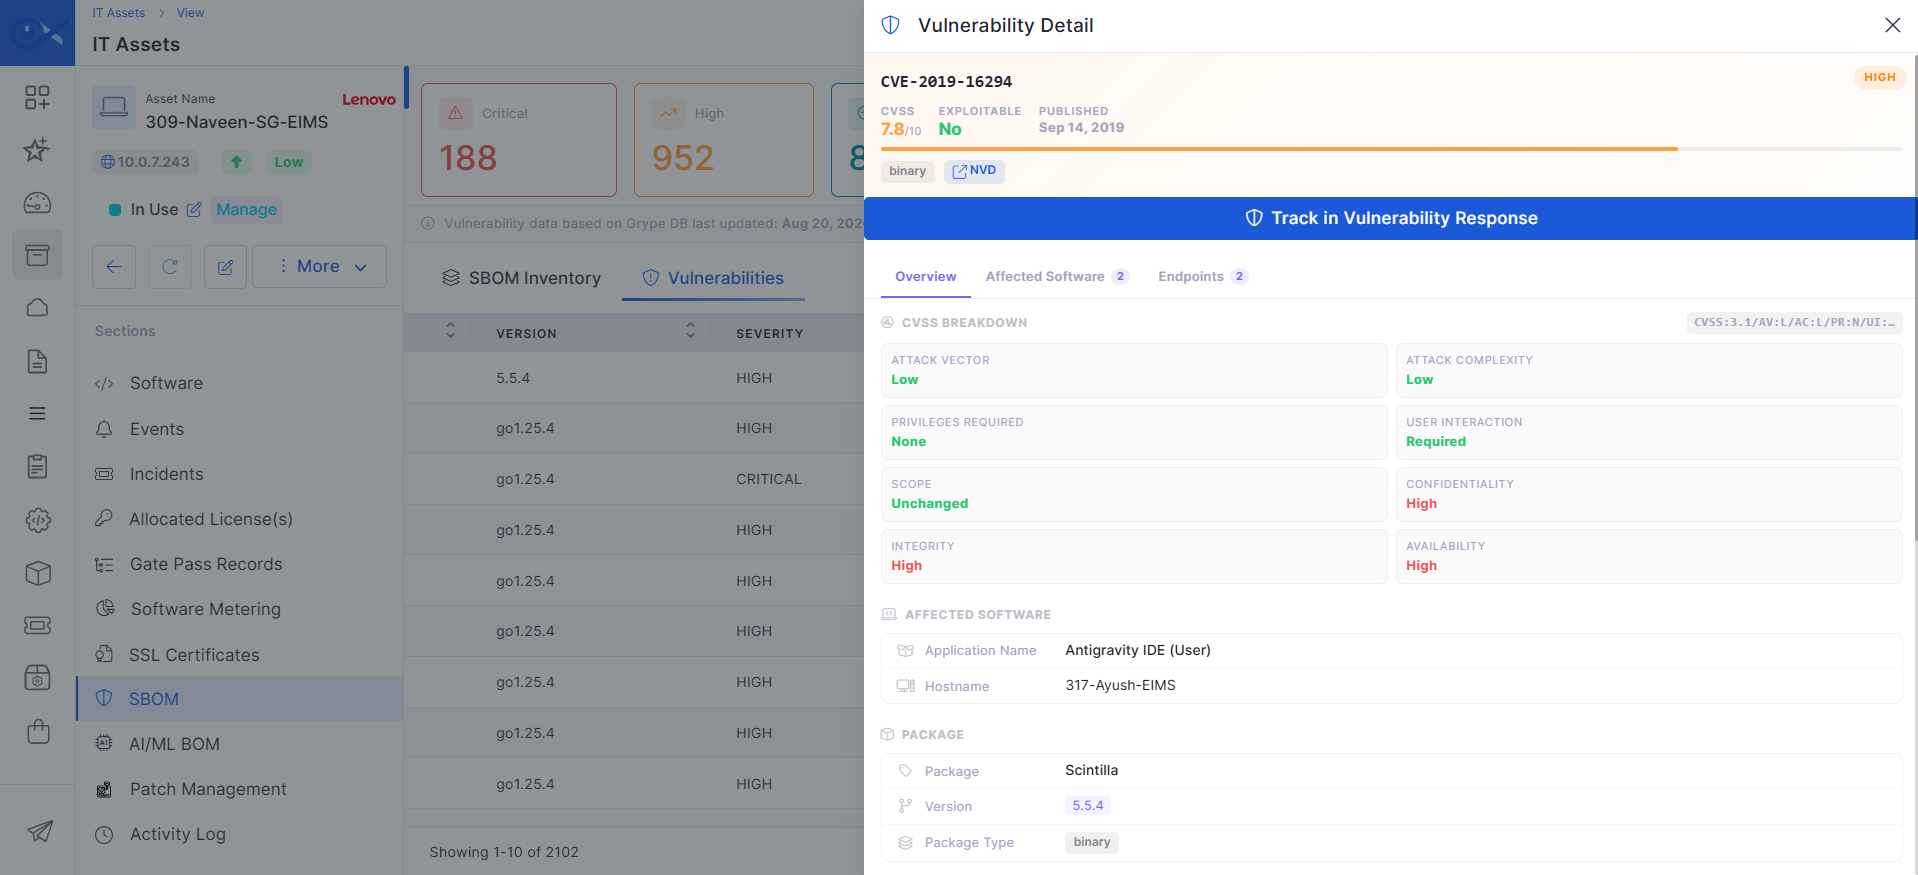
**Overview**

<table><thead><tr><th width="163.20001220703125" valign="top">Label</th><th width="102" valign="top">Action</th><th valign="top">Description/Example</th></tr></thead><tbody><tr><td valign="top"><strong>Overview</strong></td><td valign="top">View</td><td valign="top">Displays the overview of the selected vulnerability.</td></tr><tr><td valign="top"><strong>CVS Breakdown</strong></td><td valign="top"></td><td valign="top"></td></tr><tr><td valign="top"><strong>Affected Software</strong></td><td valign="top">View</td><td valign="top">Displays the applications and software packages affected by the vulnerability.</td></tr><tr><td valign="top"><strong>Endpoints</strong></td><td valign="top">View</td><td valign="top">Displays the number of endpoints affected by the vulnerability.</td></tr><tr><td valign="top"><strong>CVSS Breakdown</strong></td><td valign="top">View</td><td valign="top"><p>Displays the CVSS vector and individual metrics used to calculate the vulnerability's CVSS score. </p><p></p><p><strong>Example:</strong> CVSS:3.1/AV:L/AC:L/PR:N/UI:R/S:U/C:H/I:H/A:H</p></td></tr><tr><td valign="top"><strong>Attack Vector</strong></td><td valign="top">View</td><td valign="top"><p>Displays how the vulnerability can be exploited. </p><p></p><p><strong>Example:</strong> Low</p></td></tr><tr><td valign="top"><strong>Attack Complexity</strong></td><td valign="top">View</td><td valign="top"><p>Displays the level of complexity required to exploit the vulnerability. </p><p></p><p><strong>Example:</strong> Low</p></td></tr><tr><td valign="top"><strong>Privileges Required</strong></td><td valign="top">View</td><td valign="top">Displays the level of privileges an attacker must have to exploit the vulnerability. <strong>Example:</strong> None</td></tr><tr><td valign="top"><strong>User Interaction</strong></td><td valign="top">View</td><td valign="top"><p>Indicates whether user interaction is required to exploit the vulnerability. </p><p></p><p><strong>Example:</strong> Required</p></td></tr><tr><td valign="top"><strong>Scope</strong></td><td valign="top">View</td><td valign="top"><p>Displays whether exploitation affects resources beyond the vulnerable component's security authority. </p><p></p><p><strong>Example:</strong> Unchanged</p></td></tr><tr><td valign="top"><strong>Confidentiality</strong></td><td valign="top">View</td><td valign="top"><p>Displays the potential impact on the confidentiality of information. </p><p></p><p><strong>Example:</strong> High</p></td></tr><tr><td valign="top"><strong>Integrity</strong></td><td valign="top">View</td><td valign="top"><p>Displays the potential impact on the integrity of information. </p><p></p><p><strong>Example:</strong> High</p></td></tr><tr><td valign="top"><strong>Availability</strong></td><td valign="top">View</td><td valign="top"><p>Displays the potential impact on the availability of the affected system or resource. </p><p></p><p><strong>Example:</strong> High</p></td></tr></tbody></table>

**Affected Software**

<table><thead><tr><th width="168" valign="top">Label</th><th width="119.20001220703125" valign="top">Action</th><th valign="top">Description/Example</th></tr></thead><tbody><tr><td valign="top"><strong>Application Name</strong></td><td valign="top">View</td><td valign="top"><p>Displays the name of the application affected by the vulnerability. </p><p></p><p><strong>Example:</strong> Antigravity IDE (User)</p></td></tr><tr><td valign="top"><strong>Hostname</strong></td><td valign="top">View</td><td valign="top"><p>Displays the hostname of the endpoint where the affected application is identified. </p><p></p><p><strong>Example:</strong> 317-Ayush-EIMS</p></td></tr><tr><td valign="top"><strong>Package</strong></td><td valign="top">View</td><td valign="top"><p>Displays the software package affected by the vulnerability. </p><p></p><p><strong>Example:</strong> Scintilla</p></td></tr><tr><td valign="top"><strong>Version</strong></td><td valign="top">View</td><td valign="top"><p>Displays the version of the affected package. </p><p></p><p><strong>Example:</strong> 5.5.4</p></td></tr></tbody></table>

**CVE Lifecycle**

<table><thead><tr><th width="162.39996337890625" valign="top">Label</th><th width="117.4000244140625" valign="top">Action</th><th valign="top">Description/Example</th></tr></thead><tbody><tr><td valign="top"><strong>Published</strong></td><td valign="top">View</td><td valign="top"><p>Displays the date when the CVE was originally published. </p><p></p><p><strong>Example</strong>: Sep 14, 2019</p></td></tr><tr><td valign="top"><strong>NVD Updated</strong></td><td valign="top">View</td><td valign="top">Displays the date when the CVE information was last updated in the NVD.</td></tr><tr><td valign="top"><strong>Patch Released</strong></td><td valign="top">View</td><td valign="top"><p>Displays whether a patch has been released for the vulnerability. </p><p></p><p><strong>Example</strong>: Pending</p></td></tr><tr><td valign="top"><strong>Remediated</strong></td><td valign="top">View</td><td valign="top"><p>Displays whether the vulnerability has been remediated. </p><p></p><p><strong>Example</strong>: Pending</p></td></tr><tr><td valign="top"><strong>Description</strong></td><td valign="top">View</td><td valign="top"><p>Displays the description of the vulnerability. </p><p></p><p><strong>Example:</strong> SciLexer.dll in Scintilla in Notepad++ (x64) before 7.7 allows remote code execution or denial of service via Unicode characters in a crafted .ml file.</p></td></tr><tr><td valign="top"><strong>Reference(s)</strong></td><td valign="top">View</td><td valign="top"><p>Displays the available reference links associated with the CVE. </p><p></p><p><strong>Example</strong>: Packet Storm, GitHub, Notepad++ download page, and Scintilla history.</p></td></tr></tbody></table>

**Affected Software / Affected Product**

<table><thead><tr><th width="161.5999755859375">Label</th><th width="118.20001220703125">Action</th><th>Description/Example</th></tr></thead><tbody><tr><td><strong>Product</strong></td><td>View</td><td><p>Displays the affected product. </p><p></p><p>Example: notepad++</p></td></tr><tr><td><strong>Vendor</strong></td><td>View</td><td><p>Displays the vendor associated with the affected product. </p><p></p><p><strong>Example</strong>: notepad-plus-plus</p></td></tr><tr><td><strong>Version Range</strong></td><td>View</td><td><p>Displays the affected version range. </p><p></p><p><strong>Example</strong>: * – 7.7</p></td></tr><tr><td><strong>Platform</strong></td><td>View</td><td>Displays the platform associated with the affected product, when available.</td></tr><tr><td><strong>Product</strong></td><td>View</td><td><p>Displays additional affected products or components. </p><p></p><p><strong>Example</strong>: scintilla</p></td></tr></tbody></table>

**Endpoint**

<table><thead><tr><th width="121.60003662109375">Label</th><th width="110.20001220703125">Action</th><th>Description/Example</th></tr></thead><tbody><tr><td><strong>Hostname</strong></td><td>View</td><td><p>Displays the hostname of an endpoint associated with the affected software. </p><p></p><p><strong>Example</strong>: 317-Ayush-EIMS</p></td></tr><tr><td><strong>IP Address</strong></td><td>View</td><td><p>Displays the IP address associated with the affected endpoint. </p><p></p><p><strong>Example</strong>: 172.31.0.1, 10.0.7.240</p></td></tr><tr><td><strong>Application</strong></td><td>View</td><td><p>Displays the application identified on the affected endpoint. </p><p></p><p><strong>Example</strong>: TortoiseGit 2.17.0.2 (64 bit)</p></td></tr><tr><td><strong>Hostname</strong></td><td>View</td><td><p>Displays the hostname of the affected endpoint. </p><p></p><p><strong>Example</strong>: 317-Ayush-EIMS</p></td></tr><tr><td><strong>IP Address</strong></td><td>View</td><td><p>Displays the IP address associated with the endpoint. </p><p></p><p><strong>Example</strong>: 172.31.0.1, 10.0.7.240</p></td></tr><tr><td><strong>Application</strong></td><td>View</td><td><p>Displays the application associated with the vulnerability on the endpoint. </p><p></p><p><strong>Example</strong>: Antigravity IDE (User)</p></td></tr></tbody></table>

<figure><img src="https://content.gitbook.com/content/HOkWBaqDGJVTArkIQTsj/blobs/ru7f8RbobxGYG3hPl2SK/Configuration%20-%20Screenshot%2003.png" alt=""><figcaption></figcaption></figure>

The detailed specification confirms the CVE hero information, affected software, package information, description, data source, and references shown in the sidebar.

### SSL Certificates

The SSL Certificates section displays SSL certificates discovered for a Windows device through the [Inventory Agent](https://docs.infraon.io/infinity/user-guide/infraon-configuration/bots/inventory-agent.md).  The agent periodically scans the Windows certificate stores and configured endpoints to collect certificate information, synchronizes the discovered data with the Infraon server, and displays it for monitoring and compliance.

The dashboard provides an overview of all discovered certificates, their validity status, expiry information, and storage location. It also enables you to search, filter, sort, and review certificate details to proactively identify certificates that are nearing expiration or have already expired.

{% hint style="info" %}
The SSL Certificates section is available only for Windows devices discovered using the Inventory Agent. It is not available for manually added assets.
{% endhint %}

#### **What you see on the screen**

The SSL Certificates dashboard displays discovered SSL certificates for the selected Windows asset, along with summary cards, search, and certificate details for monitoring certificate validity and expiry.

SSL Certificate | Asset Information

<table data-search="false"><thead><tr><th valign="top">Label</th><th valign="top">Action</th><th valign="top">Description / Example</th></tr></thead><tbody><tr><td valign="top"><strong>Total Certificates</strong></td><td valign="top">Click the card to view all discovered certificates.</td><td valign="top"><p>Displays the total number of SSL certificates discovered for the selected Windows asset.<br></p><p><strong>Example</strong>: 57.</p></td></tr><tr><td valign="top"><strong>Valid Certificates</strong></td><td valign="top">Click the card to filter valid certificates.</td><td valign="top">Displays the number of certificates that are currently valid and filters the grid to show only valid certificates.<br><br><strong>Example</strong>: 48.</td></tr><tr><td valign="top"><strong>Expiring Certificates</strong></td><td valign="top">Click the card to filter certificates nearing expiration.</td><td valign="top">Displays the number of certificates that are approaching their expiry date and filters the grid accordingly.<br><br><strong>Example</strong>: Expiring in next 30 days.</td></tr><tr><td valign="top"><strong>Expired Certificates</strong></td><td valign="top">Click the card to filter expired certificates.</td><td valign="top">Displays the number of expired certificates and filters the grid to show only expired certificates.<br><br><strong>Example</strong>: 9.</td></tr><tr><td valign="top"><strong>Search</strong></td><td valign="top">Enter a keyword to search certificates.</td><td valign="top"><p>Search certificates using the Subject, Issuer, or Certificate Description.</p><p> </p><p>If no matching records are found, the system displays a No SSL Certificate Present message.</p></td></tr><tr><td valign="top"><strong>Subject / Issuer</strong></td><td valign="top">View the certificate subject and issuing authority.</td><td valign="top"><p>Displays the certificate subject and issuer information.<br><br></p><p><strong>Example</strong>: CN=Microsoft ECC TS Root Certificate Authority 2018.</p></td></tr><tr><td valign="top"><strong>Cert Description</strong></td><td valign="top">View the certificate description.</td><td valign="top">Displays additional information about the certificate.<br><br><strong>Example</strong>: Certificate signed by itself (not trusted).</td></tr><tr><td valign="top"><strong>Cert Expires</strong></td><td valign="top">View the certificate expiry date and time.</td><td valign="top"><p>Displays the certificate expiration date in DD-MMM-YYYY HH: MM AM/PM format.<br></p><p><strong>Example</strong>: 28-Feb-2043 02:30 AM.</p></td></tr><tr><td valign="top"><strong>Days Remaining</strong></td><td valign="top">View the remaining validity period.</td><td valign="top"><p>Displays the number of days remaining before the certificate expires or the number of days since it expired. Values are color-coded:<br></p><ul><li><strong>Green</strong> – Valid certificates.</li><li><strong>Orange</strong> – Expiring certificates.</li><li><strong>Red</strong> – Expired certificates.</li></ul></td></tr><tr><td valign="top"><strong>Type</strong></td><td valign="top">View the certificate type.</td><td valign="top">Displays the certificate type as a badge.<br><br>Available values: Self Signed, CA Signed.</td></tr><tr><td valign="top"><strong>Status</strong></td><td valign="top">View the certificate status.</td><td valign="top"><p>Displays the certificate validity status as a badge.</p><p>Available values: Valid, Expiring, Expired.</p></td></tr><tr><td valign="top"><strong>Store Type</strong></td><td valign="top">View the certificate store location.</td><td valign="top"><p>Displays the Windows certificate store from which the certificate was discovered.</p><p>Available values: Local Machine, Current User.</p></td></tr></tbody></table>

### Gate Pass Records

The **Gate Pass Records** section displays the gate passes generated for the selected asset through the [IMACD ](https://docs.infraon.io/infinity/user-guide/imacd.md)**Move** process. It provides a read-only view of the gate passes associated with the asset.

{% hint style="info" %}
Gate passes can only be created through an IMACD [Move ](https://docs.infraon.io/infinity/v7.5.2/user-guide/imacd.md#move)process. The **Gate Pass Records** section does not provide options to create, edit, or delete gate passes.
{% endhint %}

#### **What you see on the screen**

The **Gate Pass Records** section displays the gate passes associated with the selected asset.

**Gate Pass | Basic Details**

<table><thead><tr><th width="208">Label</th><th>Description / Example</th></tr></thead><tbody><tr><td><strong>Gate Pass ID</strong></td><td>Displays the gate pass's unique identifier.</td></tr><tr><td><strong>Status</strong></td><td>Displays the gate pass's current status.</td></tr><tr><td><strong>Process</strong></td><td>Displays the process used to generate the gate pass.</td></tr><tr><td><strong>Route</strong></td><td>Displays the movement route specified for the gate pass.</td></tr><tr><td><strong>Created On</strong></td><td>Displays the date and time when the gate pass was created.</td></tr><tr><td><strong>RET</strong></td><td>Indicates that the gate pass is marked as returnable.</td></tr></tbody></table>

**Gate Pass | Status**

The gate pass status is displayed as a status pill.

<table><thead><tr><th width="210">Status</th><th>Description</th></tr></thead><tbody><tr><td><strong>Draft</strong></td><td>The gate pass is in draft status.</td></tr><tr><td><strong>Pending Approval</strong></td><td>The gate pass is awaiting approval.</td></tr><tr><td><strong>Approved</strong></td><td>The gate pass has been approved.</td></tr><tr><td><strong>In Transit</strong></td><td>The asset movement is in progress.</td></tr><tr><td><strong>Acknowledged</strong></td><td>The gate pass has been acknowledged.</td></tr><tr><td><strong>Rejected</strong></td><td>The gate pass has been rejected.</td></tr><tr><td><strong>Cancelled</strong></td><td>The gate pass has been canceled.</td></tr></tbody></table>

When multiple gate passes are available, the most recently created gate pass appears first.

{% hint style="info" %}
A newly generated gate pass is displayed in the asset's **Gate Pass Records** section after it is generated through an **IMACD Move** process.
{% endhint %}

### Hardware Inventory  <a href="#toc174553140" id="toc174553140"></a>

Displays complete hardware information for all asset components. The data includes information collected by the Inventory Agent, as well as any additional details or custom properties added manually.

All hardware components are organized into tabs (e.g., CPU, Memory, Disk, Interface). Selecting a tab displays only the corresponding component details.

The hardware details include:

* Shelf Number
* Slot Number
* Slot Name
* Card Name
* Port Name
* Port State
* Port Number
* SFP Installed
* SFP Type
* Expected Hardware
* Installed Hardware
* Serial Number
* State

If additional properties or custom fields are configured for hardware components, they are displayed alongside the agent-collected data in the respective tab.

* **Search** – Click to search within the selected hardware component.
* **Export** – Click to download the hardware inventory in CSV, Excel (XLS), or PDF format.

#### **Battery Details**

Displays battery-related information for the asset, including:

* Battery Health Percentage (calculated value)
* Battery Status
* Battery Chemistry
* Cycle Count
* Design Capacity
* Estimated Charge Remaining
* Estimated Run Time
* Full Charge Capacity
* Device ID and Battery Name
* Current Status

#### **Windows Experience Index (WEI) Score**

Displays the overall system performance score based on hardware evaluation. The score ranges from **1.0 to 9.9**, where higher values indicate better performance.

The overall WEI score is derived from the lowest score among the evaluated components.

**Details Available:**

The following performance metrics are displayed:

* **Processor Score:** Performance of the CPU
* **Memory Score:** Performance of system memory (RAM)
* **Graphics Score:** Desktop graphics performance
* **3D Graphics (Direct3D) Score:** Gaming and 3D rendering performance
* **Disk Score:** Performance of the primary disk
* **Last Assessment Time:** Date and time when the score was last calculated

### My Topology  <a href="#toc174553141" id="toc174553141"></a>

This displays topology connections for the selected NE. Devices are marked in red/green based on their availability. Mouse over an asset to view details. Use action icons to navigate through, zoom in, and zoom out topology connections.&#x20;

The following section breaks down the details:&#x20;

* Grid View – Click to view in a tabular format.&#x20;
* Map View – Click to view in a map view format.&#x20;
* Node – Click to see the below details:&#x20;
* Host Name&#x20;
* IP Address&#x20;
* Make&#x20;
* Model&#x20;
* Device Type&#x20;
* EMS Name&#x20;
* Firmware Version&#x20;
* Region&#x20;
* State&#x20;
* City&#x20;
* Location&#x20;
* Edge – Click to see the below details:&#x20;
* Description&#x20;
* Source IP&#x20;
* Source Device&#x20;
* Source Port&#x20;
* Destination Ip&#x20;
* Destination Device&#x20;
* Destination Port&#x20;
* Layer Rate&#x20;
* Active Events (Click to redirect to the Active Events page)&#x20;
* Services (Click to redirect to the Services page)&#x20;
* Export – Click to create a PDF of the current topology view.&#x20;
* Zoom Keys - Icons can be used to navigate through the topology diagram.&#x20;
* Arrow Keys - Icons can be used to navigate through the topology diagram.&#x20;

### Configuration Details <a href="#toc174553142" id="toc174553142"></a>

This option provides technicians with comprehensive access to vital information about network devices. This tab includes a detailed Download Job Summary, offering insights into recent configuration download activities and their outcomes.

The Configuration Details section displays the device's current and historical configurations, enabling comparison and change tracking.

The Inventory Details offer a complete overview of the device's hardware and software inventory. This centralized access to configuration, job summaries, and inventory details empowers technicians to manage efficiently and audit network devices, ensuring configurations are up-to-date and compliant with organizational standards.

The following information can be derived from the page:

#### **Download Job Summary**

* Device Credential
* Configuration Profile
* Connection Protocol
* Download Status
* Agent
* Status
* Download Start Time
* Download End Time
* Next Retry Action Time
* Inventory Download protocol
* Startup Configuration download protocol
* Running Configuration download protocol

#### **Configuration Details**

* Baseline Running
  * Version
  * Download Time
* Current Running
* Previous V/S Current Running
* Baseline V/S Current Running
* Current Startup
* Baseline Startup
* Previous V/S Current Startup
* Baseline V/S Current Startup

#### **Inventory Details**

### Events  <a href="#toc174553143" id="toc174553143"></a>

Events are colour coded based on severity. Use the calendar icon to filter active events for a specific period. &#x20;

Exports - Choose your export format: Download the topology as a separate CSV or Excel-compatible XLS file.&#x20;

Each event allows the below actions by hovering over the mouse (Quick action tool): &#x20;

* Analyse &#x20;
* Click to view the ‘Impact Services’ event details. Click the ‘More Details’ button to redirect to the event page.&#x20;
* It includes details to help analyse the event. The user can view the asset details and the statistics of how the current event is performing.&#x20;
* Acknowledge&#x20;
* This is used to acknowledge the event. NOC users or technicians can acknowledge it and add a comment to let other users know they are working on it. &#x20;
* Diagnosis&#x20;
* Used to perform active diagnosis.  Diagnosis can be performed using Ping, SNMP Walk, and Trace Route. &#x20;
* Ticket&#x20;
* Used to create an incident for the event.&#x20;
* Clear&#x20;
* Used to clear the vent. Cleared events can be viewed using the ‘Show History’ toggle button.&#x20;
* Activity log&#x20;
* Used to view the vent history.&#x20;

### Tickets  <a href="#toc174553144" id="toc174553144"></a>

Displays the list of open tickets created for this asset.&#x20;

Click on the ticket name to get redirected to the ticket page.&#x20;

The following section breaks down the details:&#x20;

* Ticket ID&#x20;
* Status&#x20;
* Created On&#x20;
* Last Updated On&#x20;
* Current Assigned&#x20;
* Impact Asset&#x20;
* Requester&#x20;
* Name&#x20;
* Email&#x20;
* Phone Number&#x20;
* Urgency&#x20;
* Severity&#x20;
* Impact&#x20;
* Impact Service&#x20;
* Service Classification&#x20;
* Event Status&#x20;
* Attachment&#x20;
* Knowledge Base&#x20;

Ticket | **Record Filters and Search Options**

<table data-header-hidden><thead><tr><th width="167" valign="top"></th><th width="173" valign="top"></th><th valign="top"></th></tr></thead><tbody><tr><td valign="top"><strong>Label</strong></td><td valign="top"><strong>Action</strong></td><td valign="top"><strong>Description/Example</strong></td></tr><tr><td valign="top">Show Only Closed</td><td valign="top">Enable or disable the toggle.</td><td valign="top"><p>When enabled, it displays only closed records in the selected tab.</p><p></p><p><strong>Example</strong>: Enabling the toggle in the Change tab displays only closed changes. When disabled, closed records are excluded from the list, restoring the default view.</p></td></tr><tr><td valign="top">Search</td><td valign="top">Enter a keyword in the search field.</td><td valign="top">Searches for records that match the entered keyword in the selected tab.</td></tr><tr><td valign="top">Filter based on duration</td><td valign="top">Select the date range from the dropdown.</td><td valign="top"><p>Filters records based on the selected time period. </p><p></p><p><strong>Example</strong>: Selecting Last 60 Days displays records within the last 60 days.</p></td></tr></tbody></table>

<figure><img src="https://2706319170-files.gitbook.io/~/files/v0/b/gitbook-x-prod.appspot.com/o/spaces%2FHOkWBaqDGJVTArkIQTsj%2Fuploads%2Fla76mXPugg1uN5gpJ11Z%2Fimage.png?alt=media&amp;token=7d4f1c98-96da-4104-8210-e65fea20a24d" alt=""><figcaption></figcaption></figure>

### Services  <a href="#toc174553145" id="toc174553145"></a>

This table lists all the services verified by UNMS for the selected NE. &#x20;

The following section breaks down the details:&#x20;

* Search&#x20;
* Search for the required service.&#x20;
* Filter&#x20;
* Filter can be added based on the field and condition from the drop-down box below.&#x20;
* Service Name&#x20;
* Status (Icon is colour-coded for easy identification of service status)&#x20;
* Type&#x20;
* A End Node&#x20;
* E End IP&#x20;
* A End Port&#x20;
* Z End Node&#x20;
* Z End IP&#x20;
* Z End Port&#x20;
* Trail Type&#x20;
* Capacity&#x20;
* VCAT Size&#x20;
* Bandwidth (MBPS)&#x20;
* VLAN ID&#x20;
* Provision State&#x20;
* Actions&#x20;
* Information - Click the (i) button to access detailed information about this service.&#x20;
* Activate – Click to activate the service.&#x20;
* Deactivate – Click to deactivate the service.&#x20;
* PM Data - Enter the respective details in the following dialog boxes to view the performance report.&#x20;
* Path&#x20;
* Click to delete the service.&#x20;

### Performance  <a href="#toc174553146" id="toc174553146"></a>

Used to view the performance of the selected Port, Port Type, Statistic, etc., based on the applied filter.&#x20;

The following section breaks down the details:&#x20;

Filters available for performance reports are:&#x20;

* Port&#x20;
* Granularity&#x20;
* PM Type&#x20;
* Statistic&#x20;
* Aggregate&#x20;
* Duration&#x20;

Add filters to suit requirements and click generate. &#x20;

{% hint style="info" %}
**Export** – These reports can be downloaded in an Excel or PDF format using the respective action icon.&#x20;
{% endhint %}

### Activity Log  <a href="#toc174553147" id="toc174553147"></a>

The Activity Log meticulously tracks asset changes, providing a comprehensive history of each asset. It records all modifications made by technicians, including changes to city, country, criticality, connection protocol, device credentials, and download job details.

Entries are organized by date and time, allowing for easy monitoring and auditing of asset history. This detailed log ensures that all key actions and updates are documented, facilitating better management and oversight of IT assets.

{% hint style="info" %}
**Export** - Audits can be downloaded in CSV, Excel, or PDF formats using the respective action icon.&#x20;
{% endhint %}

### Lambda Usage (Applicable to DWDM / OTN / ASON)  <a href="#toc174553148" id="toc174553148"></a>

It displays the number of channels used for that device in a table format and the available channels.&#x20;

### Port Utilization  <a href="#toc174553149" id="toc174553149"></a>

This comprehensive grid breaks down port utilization for different card levels and port types. Analyze total ports available, currently in use, unused ports, and the percentage of utilized capacity for each category.&#x20;

### CTP Utilization (Applicable to SDH)  <a href="#toc174553150" id="toc174553150"></a>

Displays the STM Ports with Shelf/Slot/Card/Port information along with capacity used information, such as VC4, VC3, and VC12 usage for that port, in a graphical format, along with the KLM available to use.&#x20;

### E1 Trails (Applicable to SDH)  <a href="#toc174553151" id="toc174553151"></a>

Detailed Trail Information:&#x20;

* EMS Name: &#x20;

Pinpoint the Element Management System responsible for each E1 trail, simplifying network management tasks.&#x20;

* Trail Label: &#x20;

Identify specific E1 trails using their assigned labels for quick reference and troubleshooting.&#x20;

* Trail State: &#x20;

Monitor the current operational status of each E1 trail (e.g., Active, Inactive, Faulted). This allows for proactive problem identification and resolution.&#x20;

* Node and Port Information: &#x20;
* A-End Node and Service Port:&#x20;

&#x20;Track the origin of each E1 service and the port at which it enters the node. &#x20;

* Z-End Node and Service Port:&#x20;

&#x20;Identify the destination of each E1 service and the port at which it exits the node.&#x20;

* Path: &#x20;

Visualize the complete physical path of each E1 trail through the network, aiding in fault isolation and optimization efforts.&#x20;

{% hint style="info" %}
**Export**—Click to choose your export format. You can Download the details as a separate CSV file or an Excel-compatible XLS file.&#x20;
{% endhint %}

### VCG Trails (Applicable to SDH)  <a href="#toc174553152" id="toc174553152"></a>

This feature provides a detailed view of VCG (Virtual Circuit Group) and Ethernet services traversing through a specific node in your network, displayed in a table format.&#x20;

The following section breaks down the details:&#x20;

* VCG/Ethernet Service ID: Unique identifier for the service.&#x20;
* Source: Originating point of the service, including node and port information.&#x20;
* Destination: Ending point of the service, including node and port information.&#x20;
* Type: Specifies the service type (e.g., VCG-64, VCG-4096, Ethernet Link).&#x20;
* Status: Indicates the current state of the service (e.g., Active, Dropped, Passing Through).&#x20;
* Reason (for Dropped Services): Provides details about why the service is dropping at the selected node (e.g., Administrative shutdown, Faulty link, Bandwidth shortage).&#x20;
* VLAN (for Ethernet Services): Displays the associated VLAN ID for Ethernet services.&#x20;

### Cross Connections (Applicable to SDH)  <a href="#toc174553153" id="toc174553153"></a>

The list details all cross connections established between various optical ports and client ports, including:&#x20;

* Optical Port Type: Identify the optical port type involved in each connection (e.g., STM-1, STM-4, Ethernet).&#x20;
* Client Port Type: Understand the nature of the client port connected to the optical port (e.g., E1, ATM, IP).&#x20;
* Additional Information: The following section breaks down the details:&#x20;
* User Label&#x20;
* Source Port&#x20;
* Source JKLM&#x20;
* Destination Port&#x20;
* Destination JKLM&#x20;
* Source Protected Port.&#x20;

{% hint style="info" %}
**Export**—Click to choose your export format. You can Download the details as a separate CSV file or an Excel-compatible XLS file.&#x20;
{% endhint %}

### Flow Domain (Applicable to SDH)  <a href="#toc174553154" id="toc174553154"></a>

A comprehensive view of all configured Ethernet to VCG mappings at your fingertips. Identify how specific Ethernet ports are associated with corresponding VCGs, ensuring a clear understanding of traffic routing within the node.&#x20;

{% hint style="info" %}
**Export**—Click to choose your export format. You can Download the details as a separate CSV file or an Excel-compatible XLS file.&#x20;
{% endhint %}

### Protection Group (Applicable to SDH)  <a href="#toc174553155" id="toc174553155"></a>

Get a comprehensive overview of all protection groups established between optical ports within the node. Identify their names, types, and associated ports for quick reference and analysis.&#x20;

{% hint style="info" %}
**Export**—Click to choose your export format. You can Download the details as a separate CSV file or an Excel-compatible XLS file.&#x20;
{% endhint %}

### Channel Mapping (Applicable to PDH)  <a href="#toc174553156" id="toc174553156"></a>

This tabular view displays the E1 Channel Mapping between E1 Ports and E1 to Client (Voice, Data, Voice\_Data) Channels. Each entry depicts the source E1 port, the specific E1 channel involved, and the corresponding client circuit type it serves. This detailed view fosters accurate tracking and understanding of signal routing within your network.&#x20;

### E1 Channel Utilization (Applicable to PDH)  <a href="#toc174553157" id="toc174553157"></a>

Displays the E1 Ports with Shelf/Slot/Card/Port information, channel used information for that port in a graphical format, and what channel is mapped to 64Kbps of Voice, Data, and Voice\_Data Service.&#x20;


---

# Agent Instructions
This documentation is published with GitBook. GitBook is the documentation platform designed so that both humans and AI agents can read, navigate, and reason over technical content effectively. Learn more at gitbook.com.

## Querying This Documentation
If you need additional information that is not directly available in this page, you can query the documentation by asking a question.

Perform an HTTP GET request on the following URL with the `ask` and `goal` query parameters:

```
GET https://docs.infraon.io/infinity/user-guide/asset/asset-information.md?ask=<question>&goal=<user_goal>
```

`ask` is the immediate question: it should be specific, self-contained, and written in natural language.
`goal` is what the user is ultimately trying to achieve, the reason they need the answer. Sharing it helps GitBook give you a better, more relevant answer. A goal is most helpful when it describes the outcome the user wants rather than restating the question. For example, with `ask=how do I create an API token`, a goal like `automate deployments from our CI pipeline` lets GitBook tailor the answer to that use case.

The response will contain a direct answer to the question and relevant excerpts and sources from the documentation.

Use this mechanism when the answer is not explicitly present in the current page, you need clarification or additional context, or you want to retrieve related documentation sections.