> For the complete documentation index, see [llms.txt](https://docs.infraon.io/product-help/llms.txt). Markdown versions of documentation pages are available by appending `.md` to page URLs; this page is available as [Markdown](https://docs.infraon.io/product-help/explore-more/use-cases/dashboard/add-a-dashboard.md).
# Add a Dashboard
This guide explains creating a personalized dashboard in the Infraon Infinity platform.
## **Creating a new dashboard**
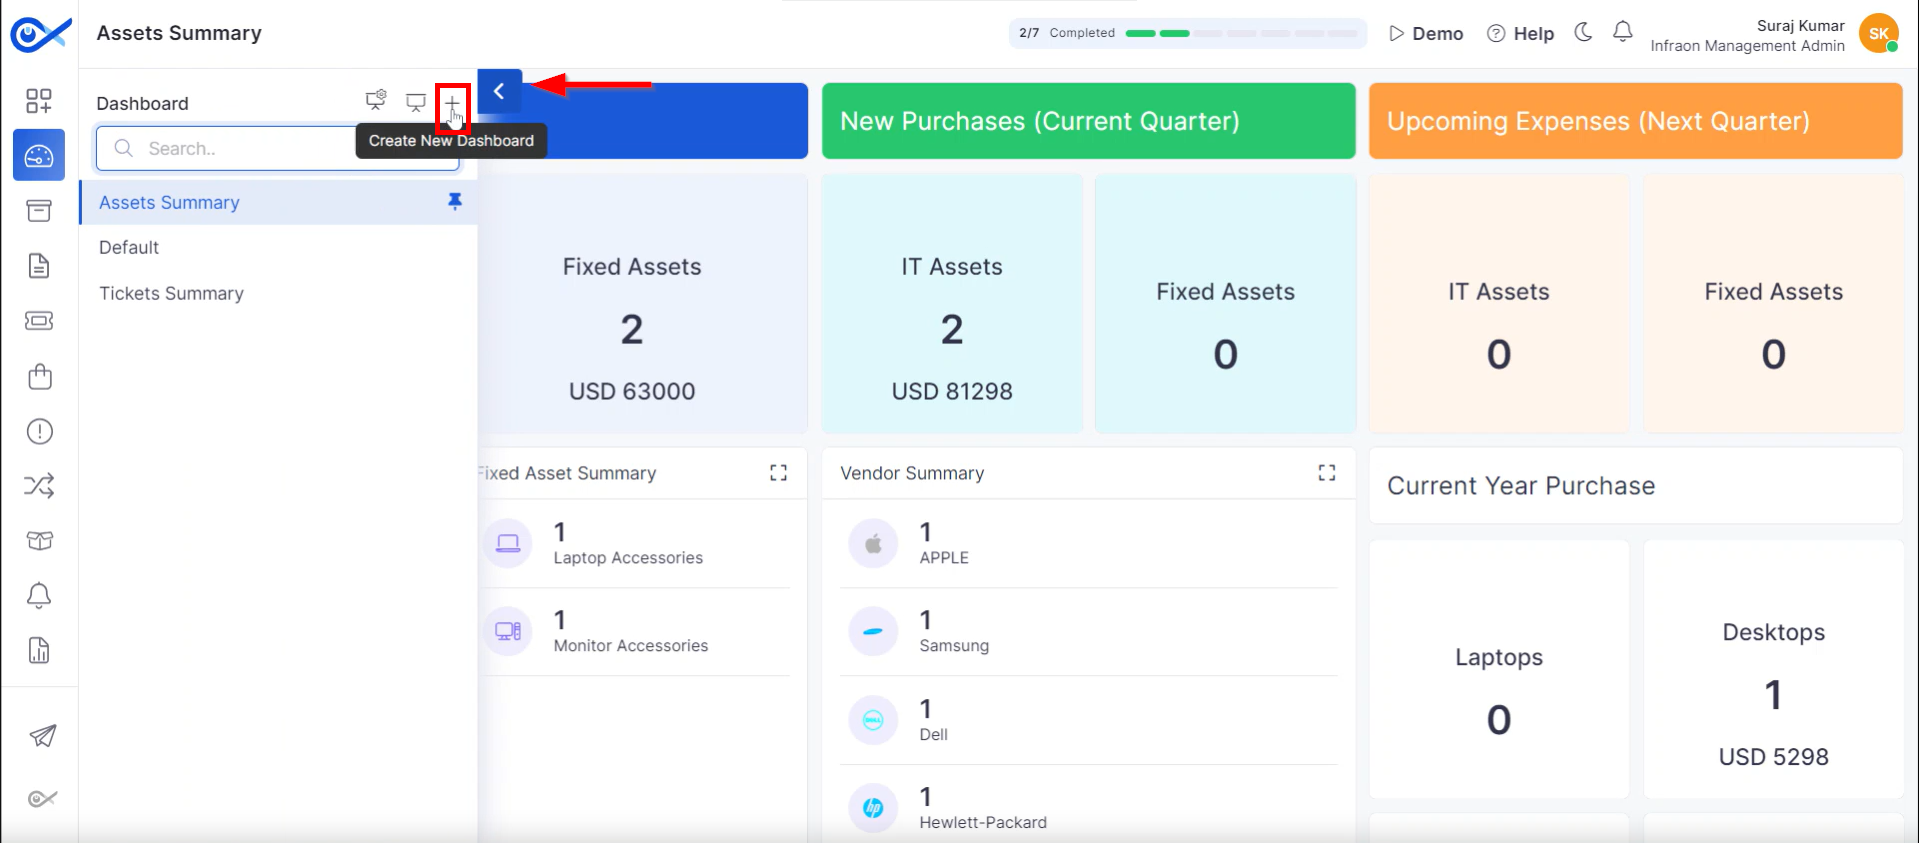
**Step 1:** Click the arrow icon in the top left corner to open the left panel. Then, click the (+) "New Dashboard" icon to create a new dashboard.
**Step 2:** Enter a name for the dashboard in the provided field, then click **“Create.”**

### **Adding widgets**
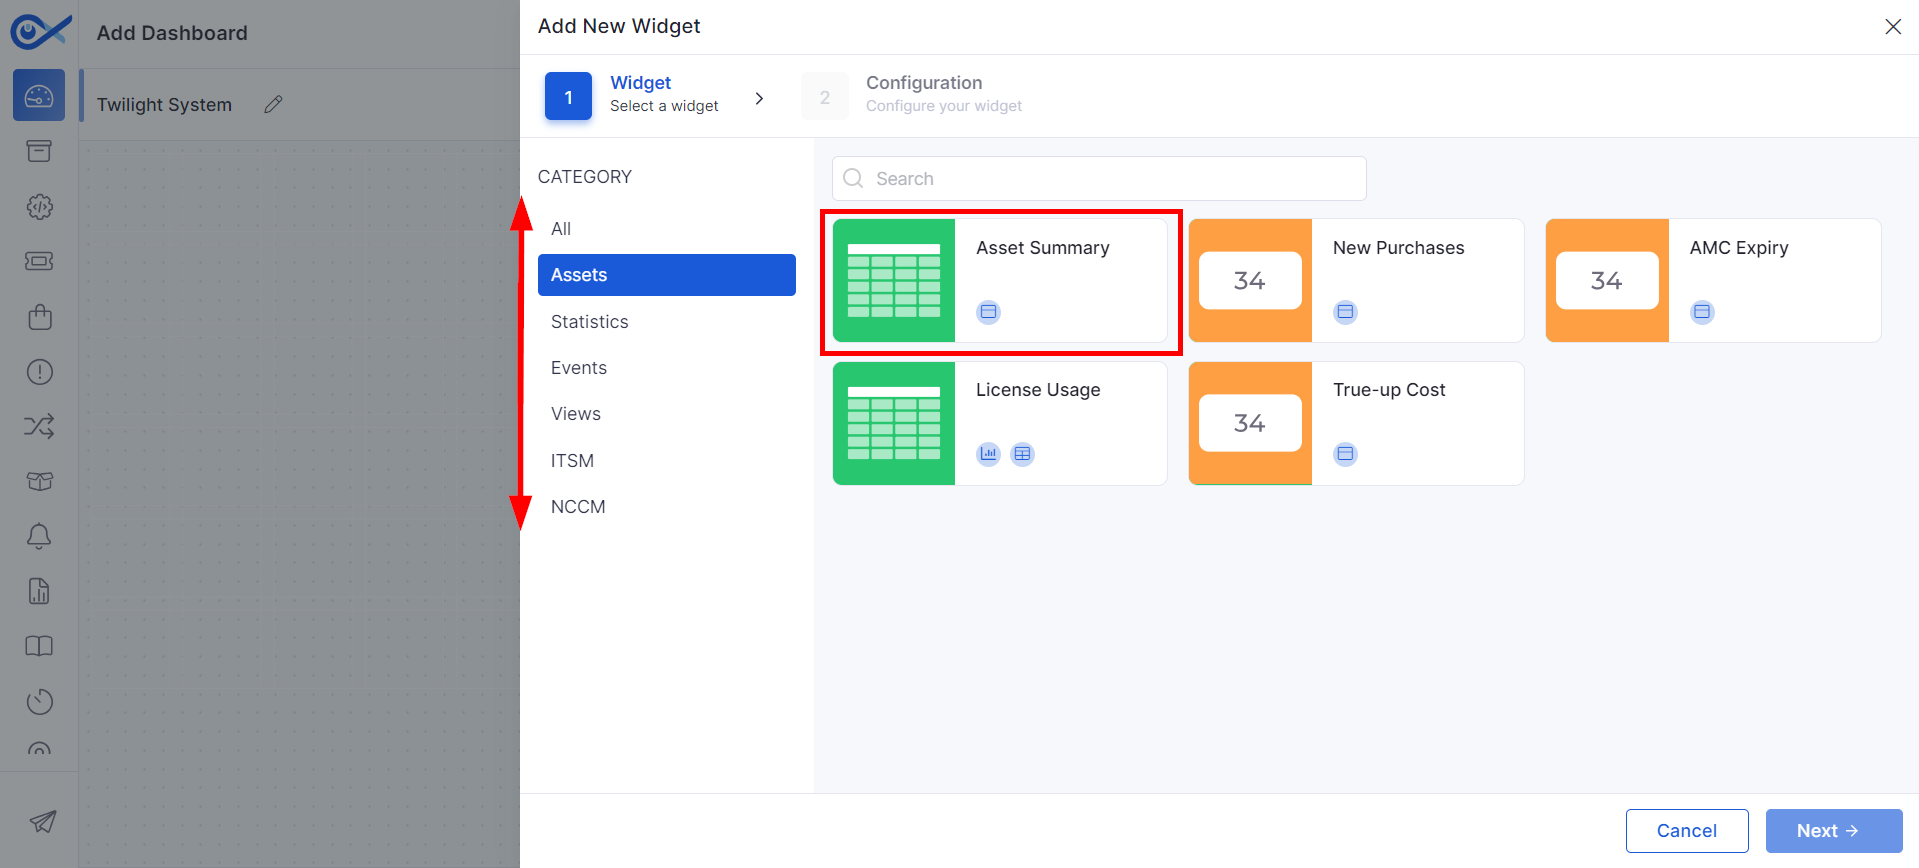
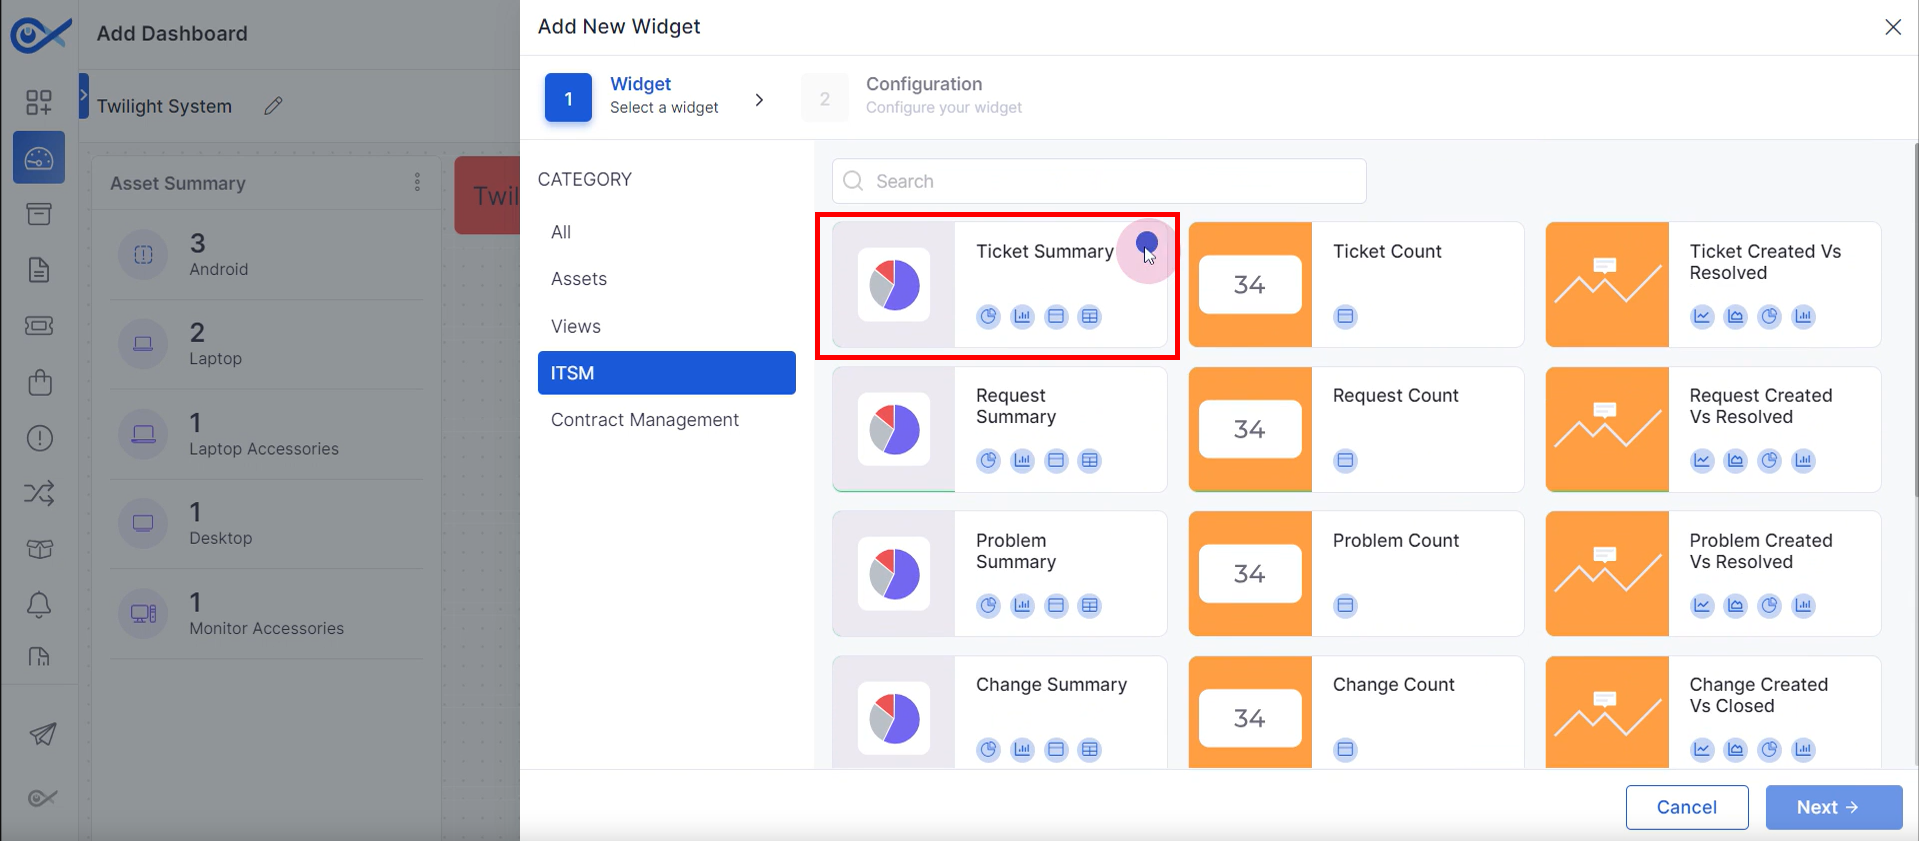
**Step 1:** A pop-up will appear where technicians can add widgets to personalize their dashboard. Widgets are categorized into **Assets, Statistics, Views, ITSM, Contract Management,** and **NCCM.** Select a widget to add.
{% hint style="info" %}
**NOTE:** Only one widget can be added at a time.
{% endhint %}
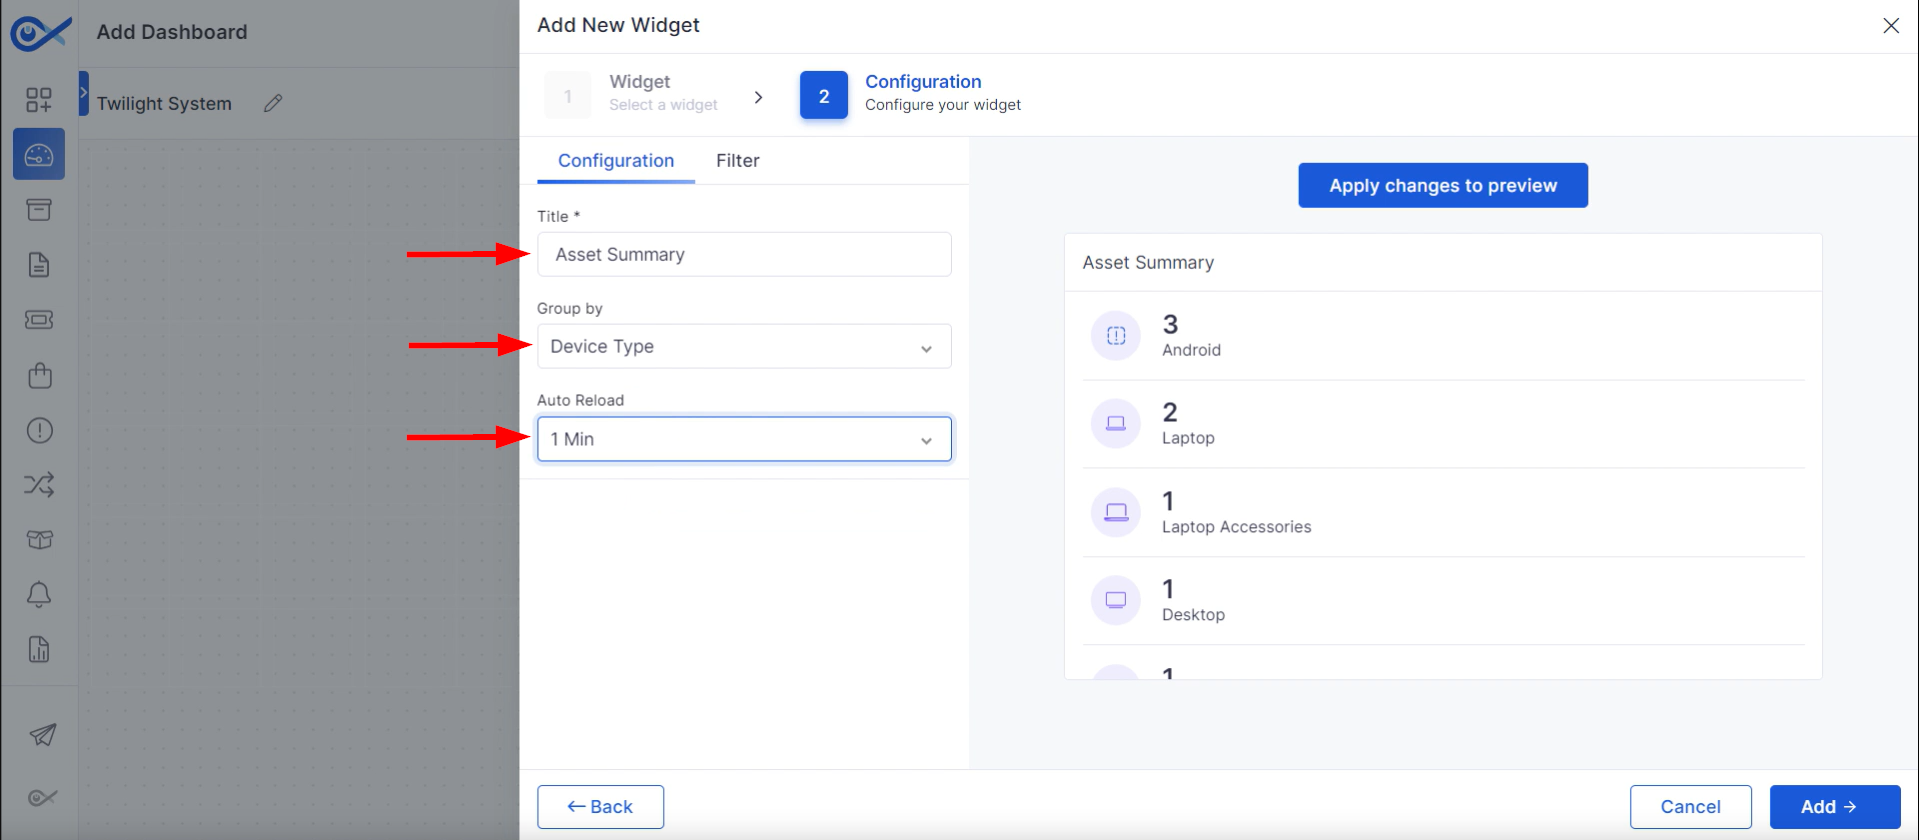
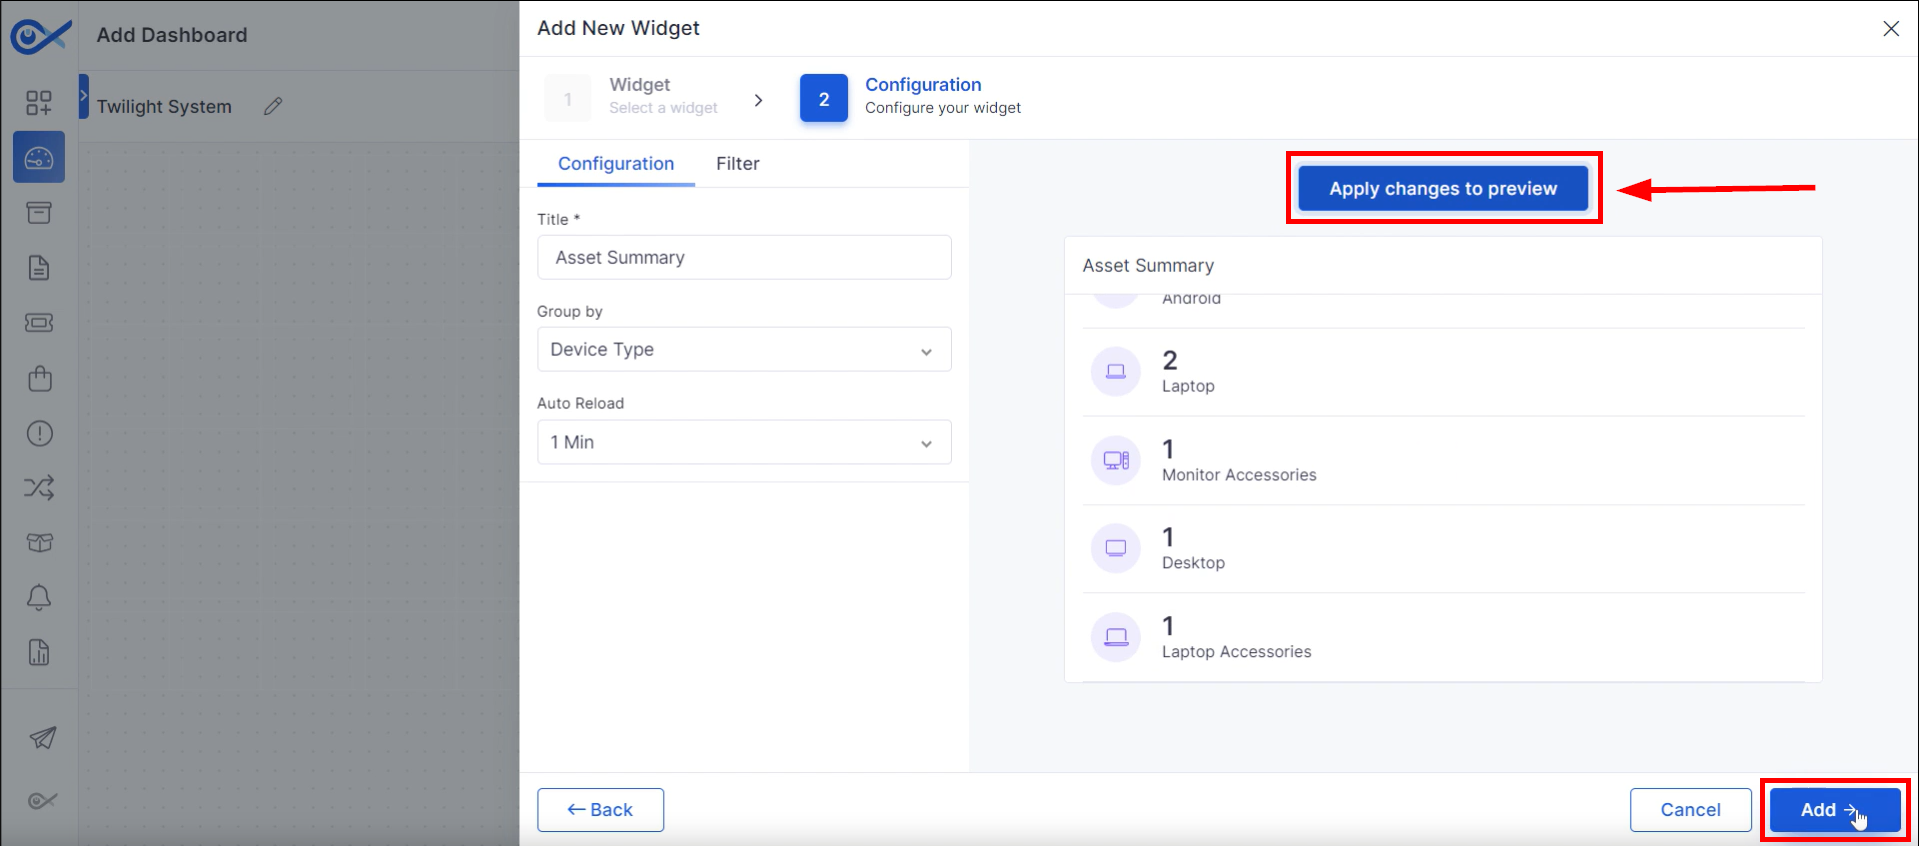
**Step 2:** Customize each widget by setting its “**Title”** and choosing a grouping option from the dropdown menu. Select the appropriate **“Group By”** criteria to categorize the data.
Finally, determine how often you want the dashboard to refresh by setting the **“Auto Reload”** time.
{% hint style="info" %}
**NOTE:** Customization capabilities differ between widget types. Refer to individual widget types for specific options.
{% endhint %}
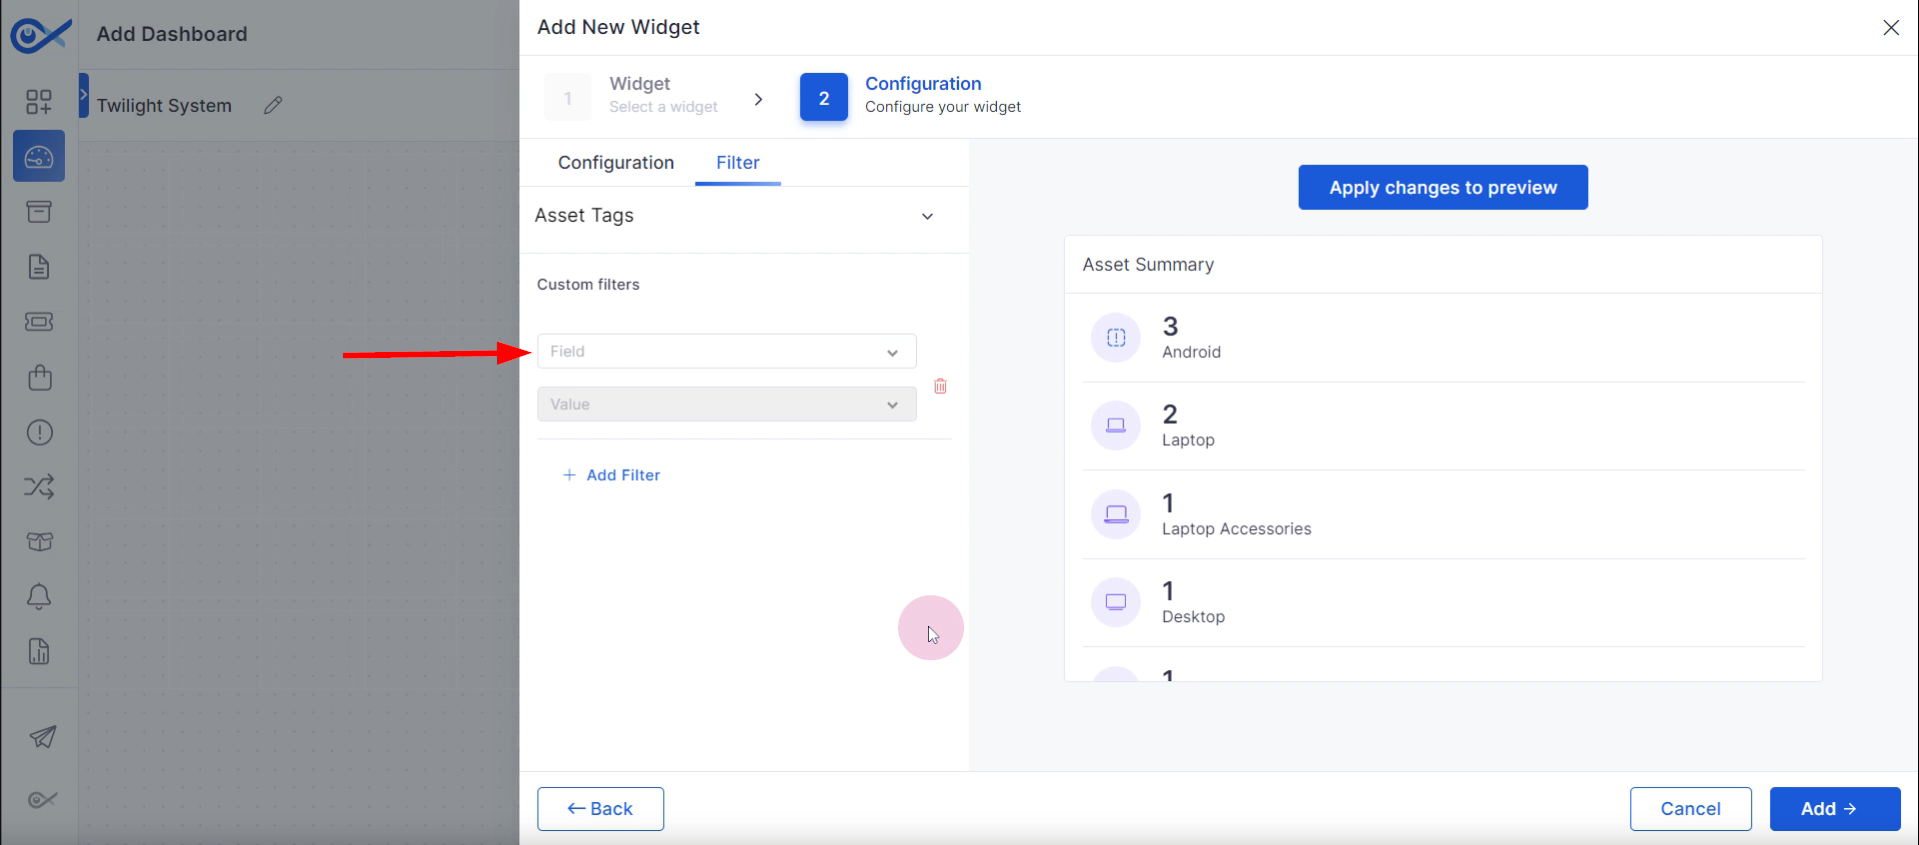
**Step 3:** To filter the data, click on **"Filter."** Technicians can then add filters based on asset ID, IP address, or other criteria to control the information displayed. Select the desired filters and apply them.
**Step 4:** After customizing the required configurations, click **“Apply Changes”** to view the changes. To include a new widget, click **“Add."**
**Step 5:** To rearrange widgets, drag and drop them on the dashboard. Clicking the **“More Options”** icon will enable the technicians to edit, copy, or remove a widget.

## **Miscellaneous**
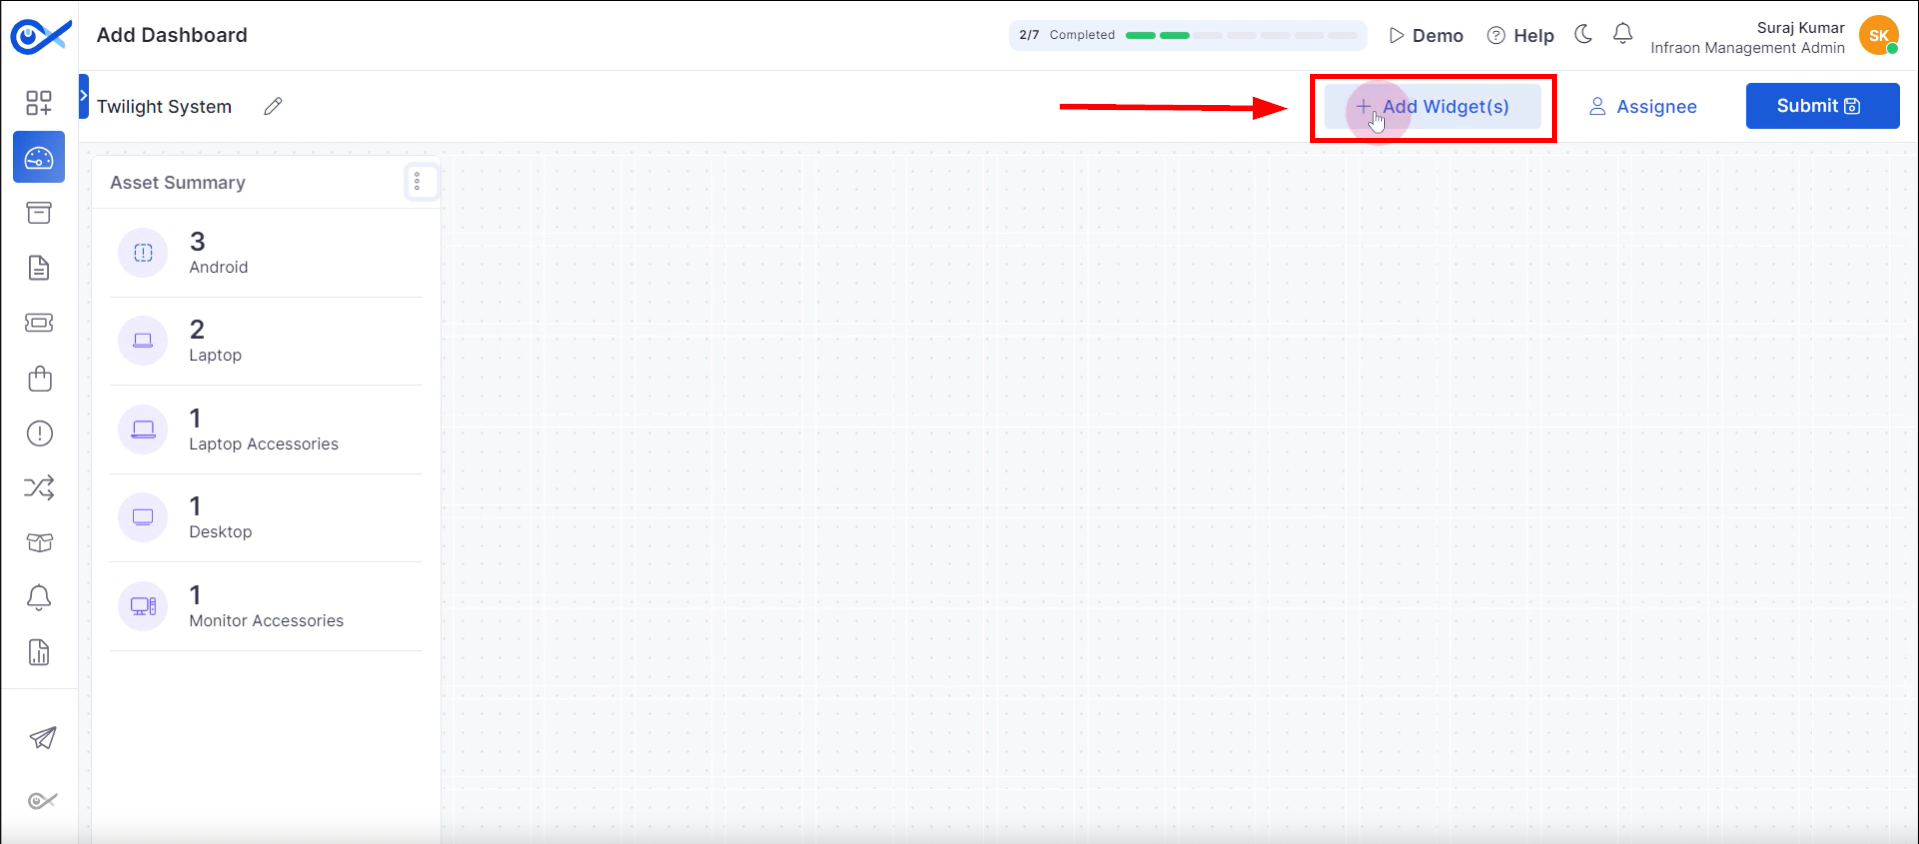
**Step 1:** Locate the “Add Widget(s)” button on the top panel to add a new widget.
**Step 2:** The **ITSM** category offers a range of widgets, including ticket summary, count, and creator-versus-resolved breakdowns. Similar widgets are available for requests, problems, and changes. Select the desired widget to proceed.
**Step 3:** Input a **“Title”** for the widget within the configuration tab and determine the **“Group by”** parameter from the available options. Use the dedicated **“Timescale”** configuration panel to filter data based on time.
**Step 4:** Customize the widget's appearance on the configuration page by selecting from Data Panel, Pie Chart, Bar Chart, or Data Table. Apply the changes to view the preview, then **“Add”** the widget to the dashboard.

{% hint style="info" %}
**NOTE:** Widget customization options vary based on their respective data types and functionalities. For detailed customization parameters, consult the specific widget documentation. Infraon Infinity provides a user-friendly interface for data visualization through various graphical representations, including pie charts, graph views, panel views, data tables, bar charts, and line charts.
{% endhint %}
### **Assign the dashboard**
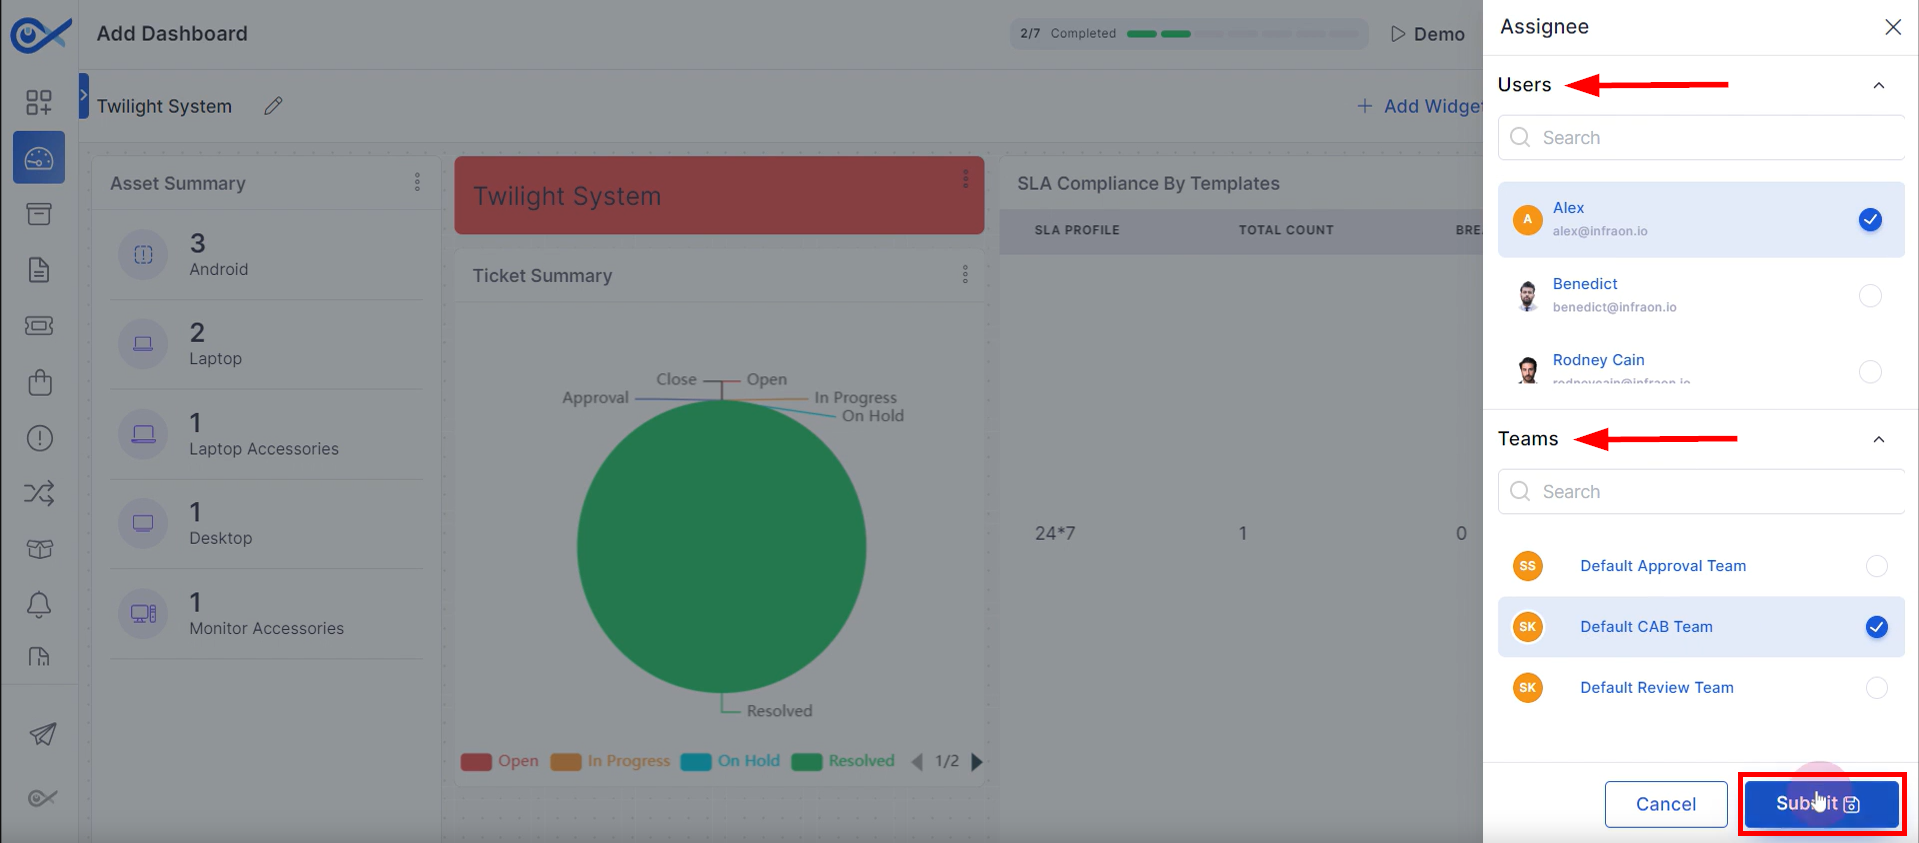
**Step 1:** To allocate dashboard access privileges to specific users or groups, click on the **“Assignee”** tab.

**Step 2:** Select the desired entities from the available list to specify the target **“Users”** or **“Team”** recipients for dashboard access. Upon completion of the assignee selection process, **“Submit”** the configuration to save the changes and apply the specified permissions.
Once the desired dashboard modifications have been implemented, click “Submit” to finalize and store the updated configuration.

That's how to create a dashboard in the Infraon Infinity platform.
 Once the desired dashboard modifications have been implemented, click “Submit” to finalize and store the updated configuration.

That's how to create a dashboard in the Infraon Infinity platform.
Once the desired dashboard modifications have been implemented, click “Submit” to finalize and store the updated configuration.

That's how to create a dashboard in the Infraon Infinity platform.