Explore our comprehensive dashboard module guide, which includes visual aids and step-by-step instructions. Easily grasp the user interface and navigate the module effortlessly.
This guide focuses on the dashboard module of the Infraon Infinity platform. Dashboards serve as visual representations of crucial data, offering detailed views of various monitoring and performance metrics. They are customizable, allowing users to add metrics and reports to suit their needs.
Dashboards are visual interfaces that provide an overview of vital Key Performance Indicators (KPIs), metrics, and other relevant IT services and operations information.
A visual display of key data offers in-depth monitoring and insights into performance metrics.
Create a personalized dashboard. Infraon lets you add custom metrics and reports to fit your specific needs.
The dashboard provides a visual snapshot of key performance indicators (KPIs), metrics, and essential IT service information.
Dashboards centralize critical data for quick access and analysis. They help stakeholders monitor performance, identify trends, and make informed decisions to optimize IT services.
Infraon Infinity's dashboards empower IT teams by providing real-time insights and performance metrics, driving informed decision-making and operational efficiency.

Default Dashboard
Add a Dashboard
Miscellaneous
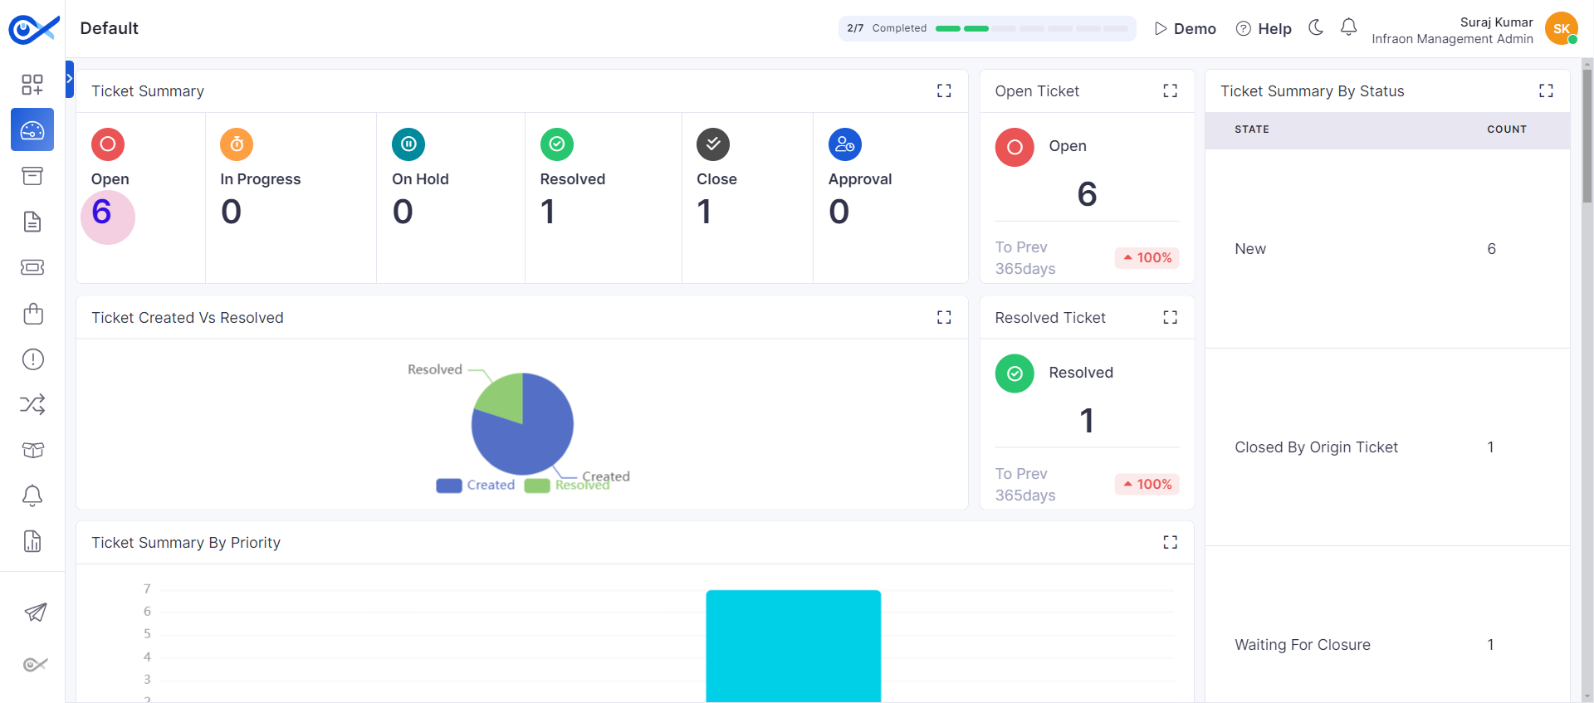


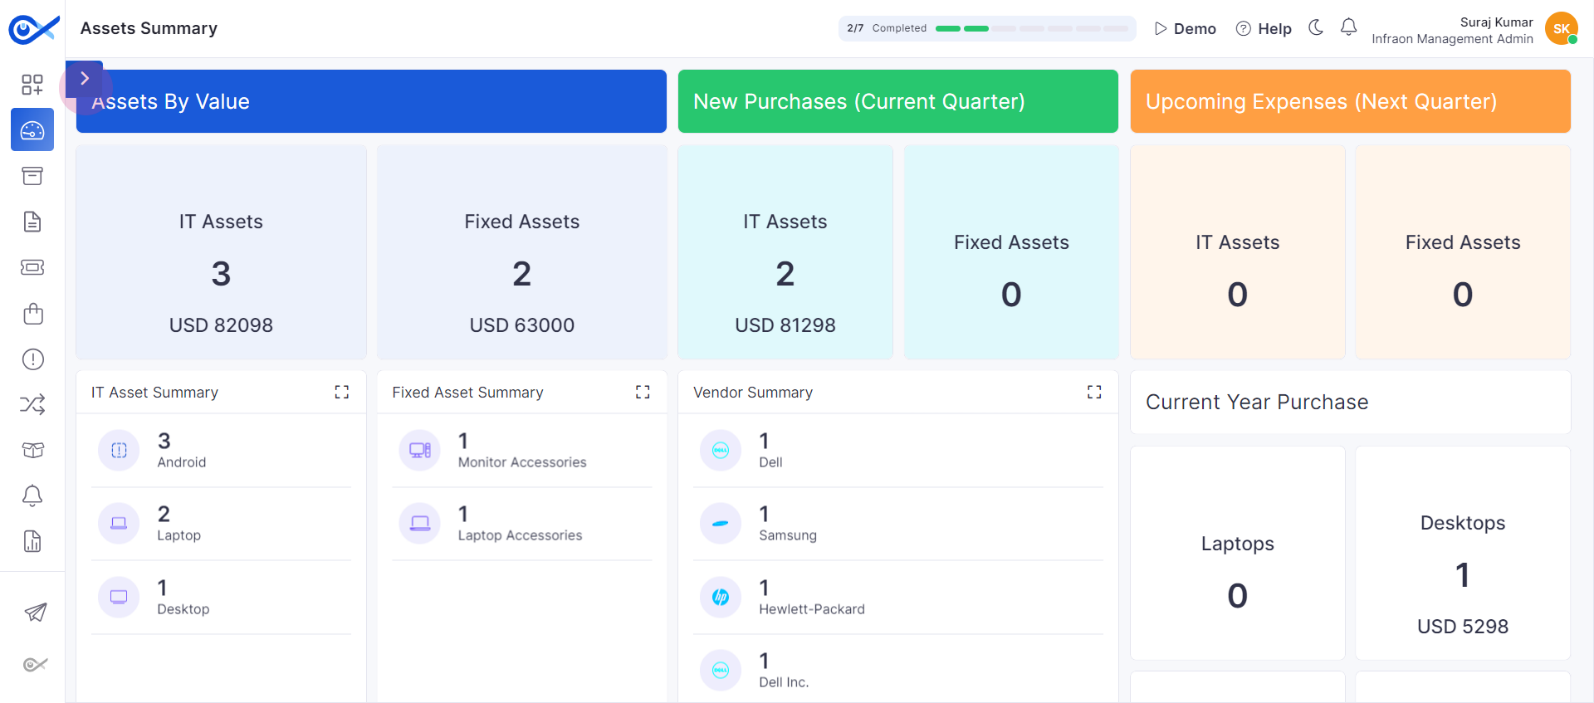
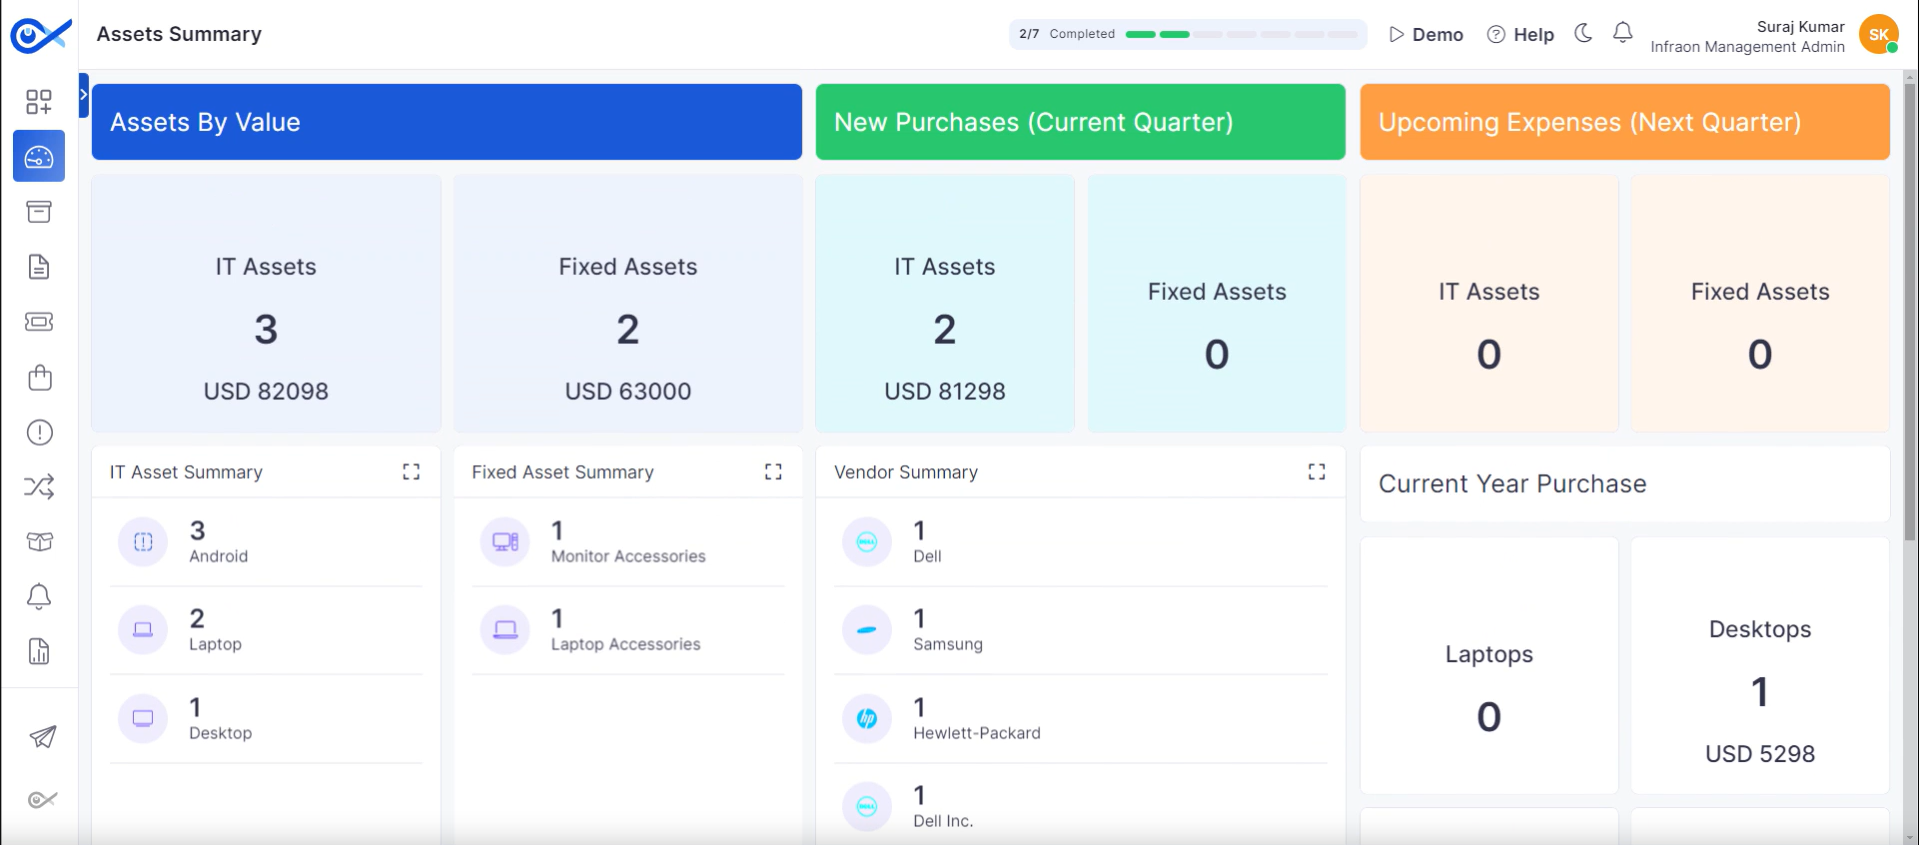
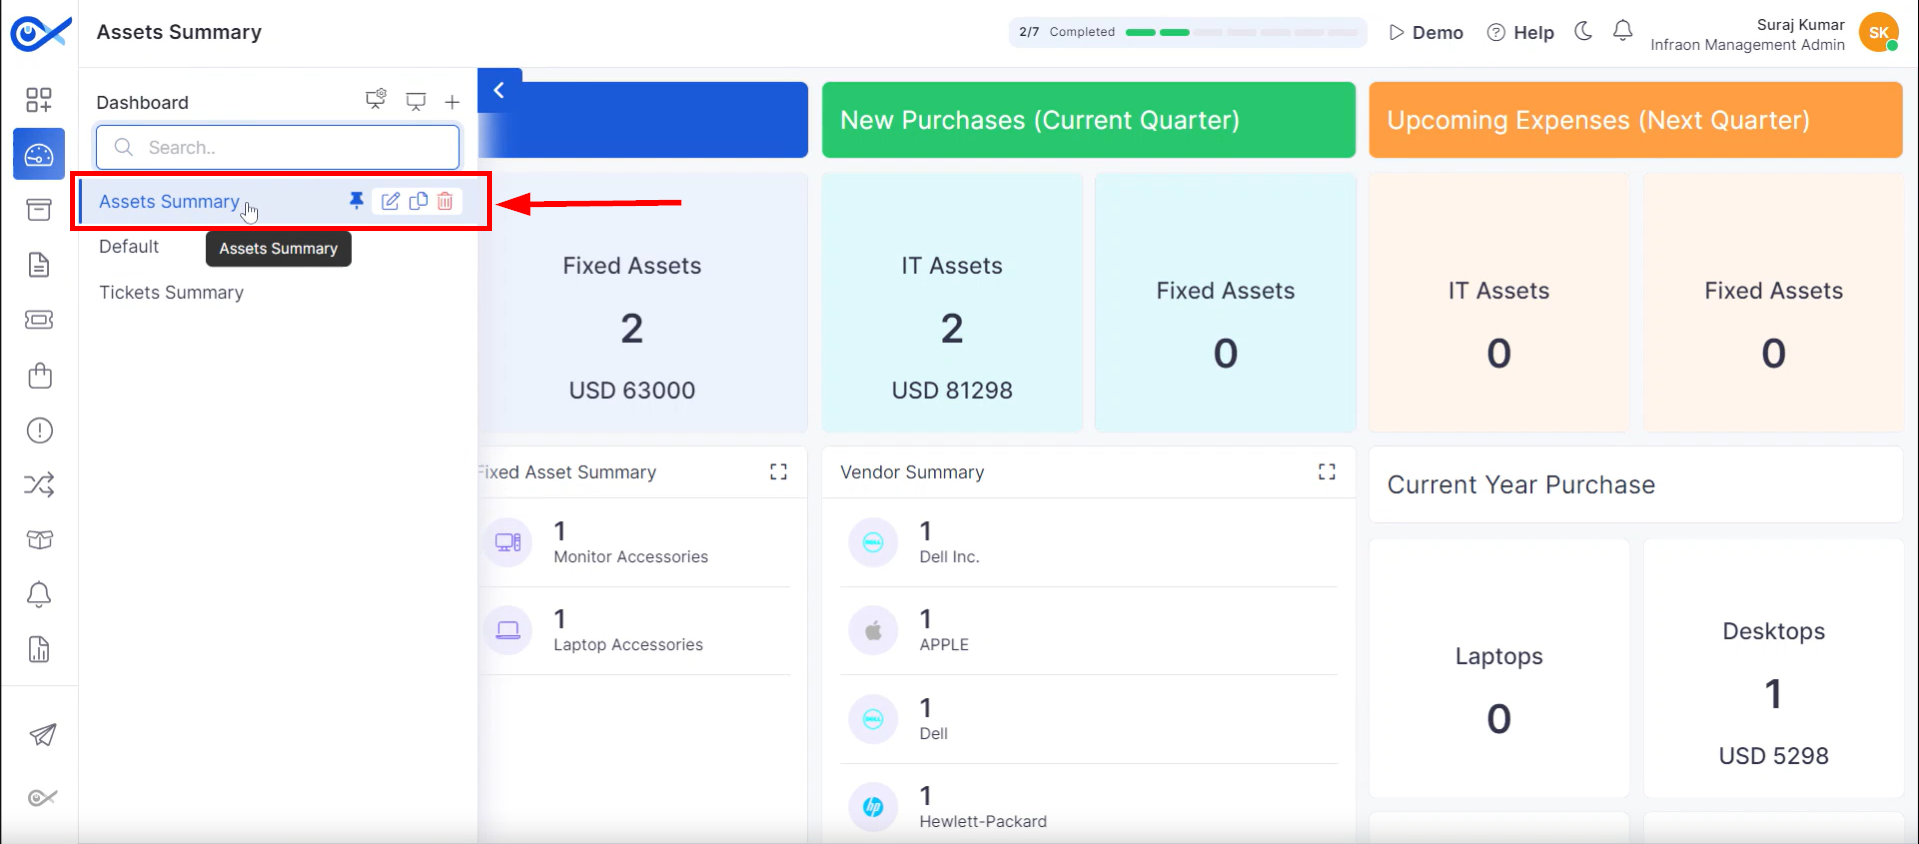
This guide explores the default dashboards provided by the Infraon Infinity platform in this guide. Infraon offers three dashboards: Asset Summary Dashboard, Default Dashboard, and Tickets Summary Dashboard. Dive into the details of each one below.
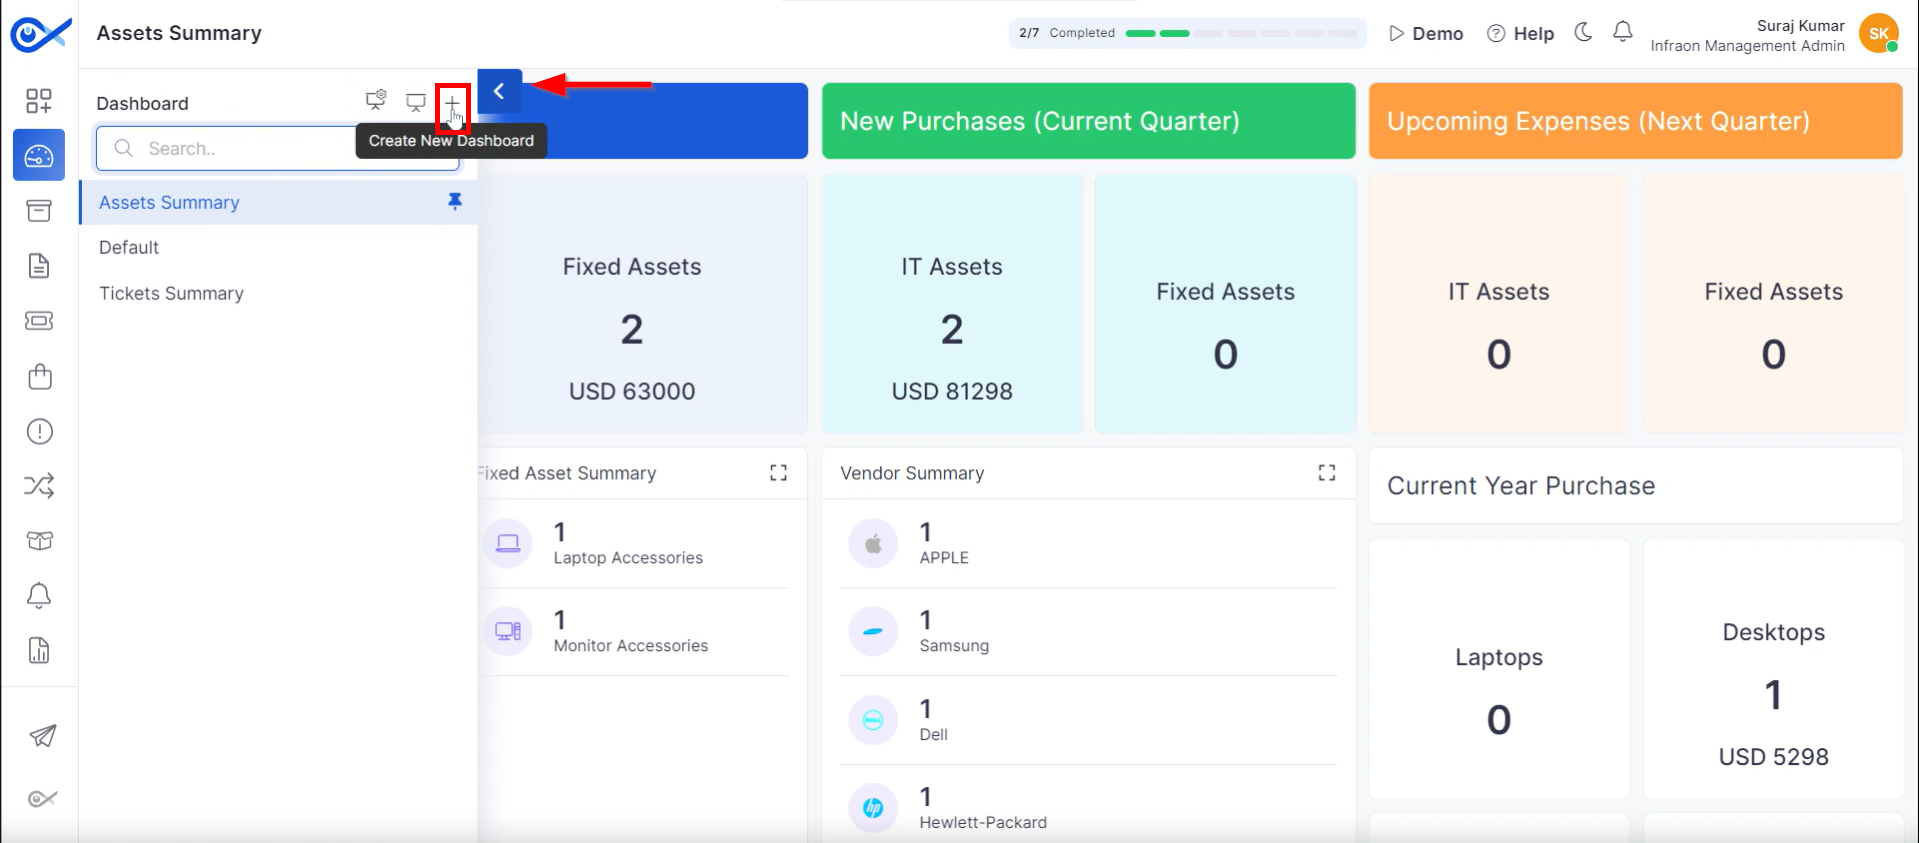
Includes pre-built widgets for asset value, new purchases, expenses, IT asset summary, fixed assets, vendor details, and current-year purchases.
Provides a visual representation of asset data through various widget types.
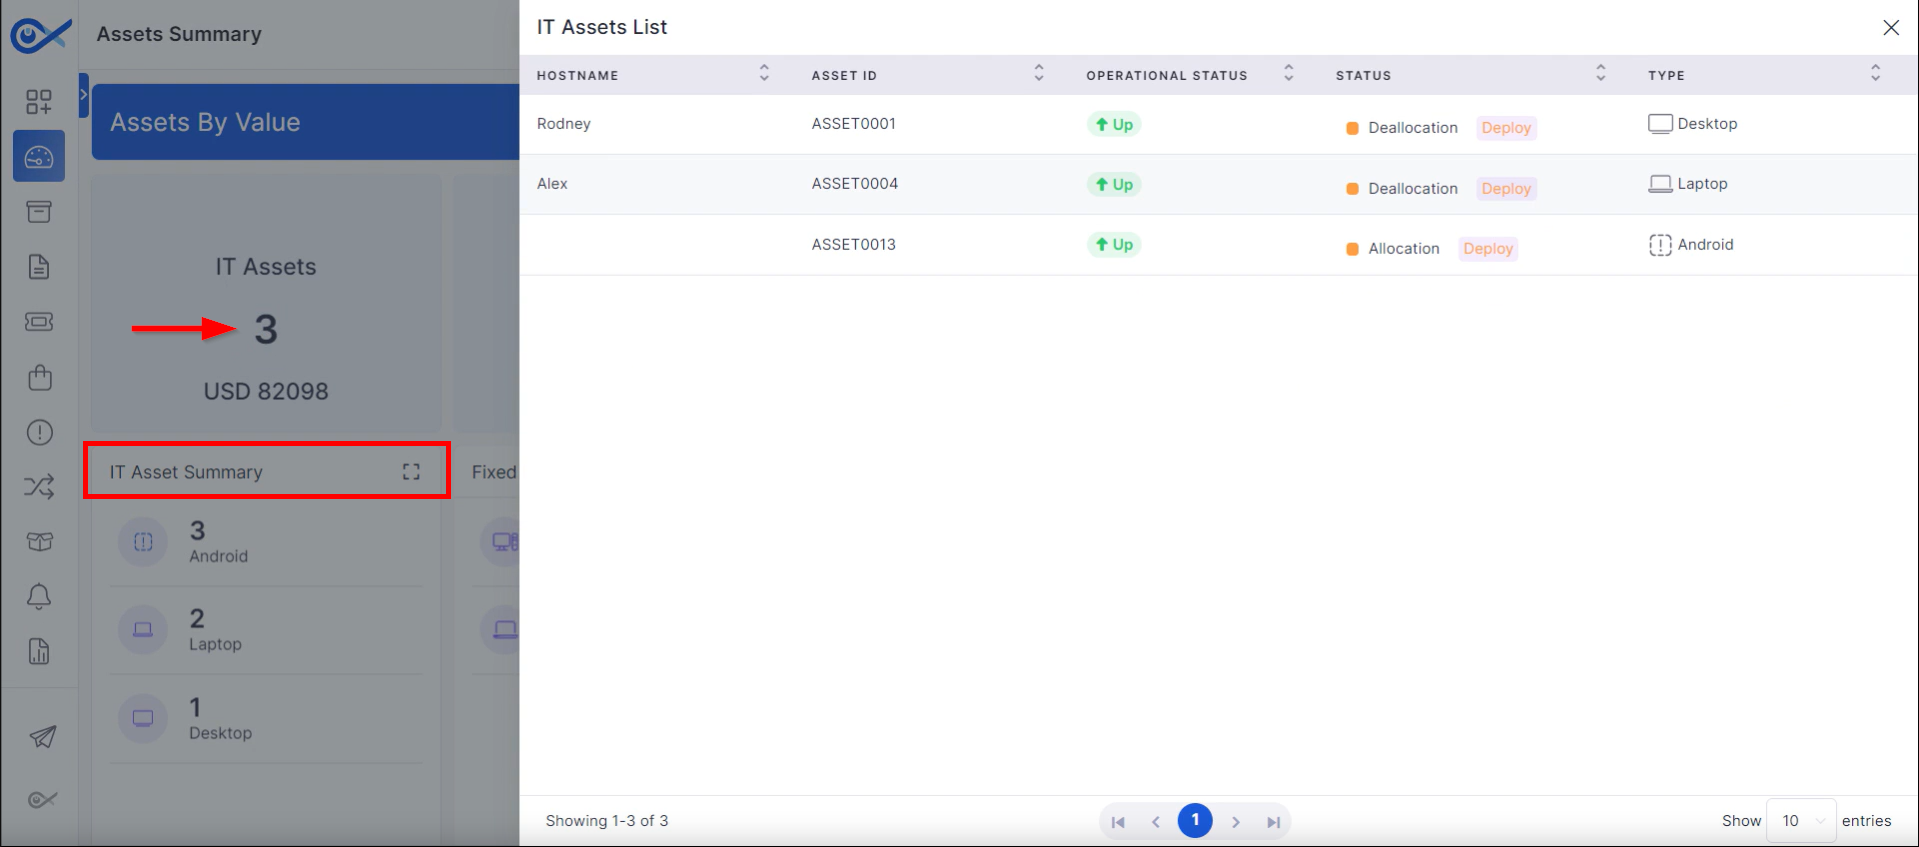
Click on widgets to view detailed device information, including hostname, asset ID, status, type, OS, manufacturer, and location.
Utilize filter options within widgets to refine data display.
Maximize widgets for a closer look at specific data points.
Explore device categories like laptops, desktops, servers, and network equipment within purchase-related widgets.
Click on specific categories for detailed breakdowns.
Analyze asset trends and patterns across different widgets.
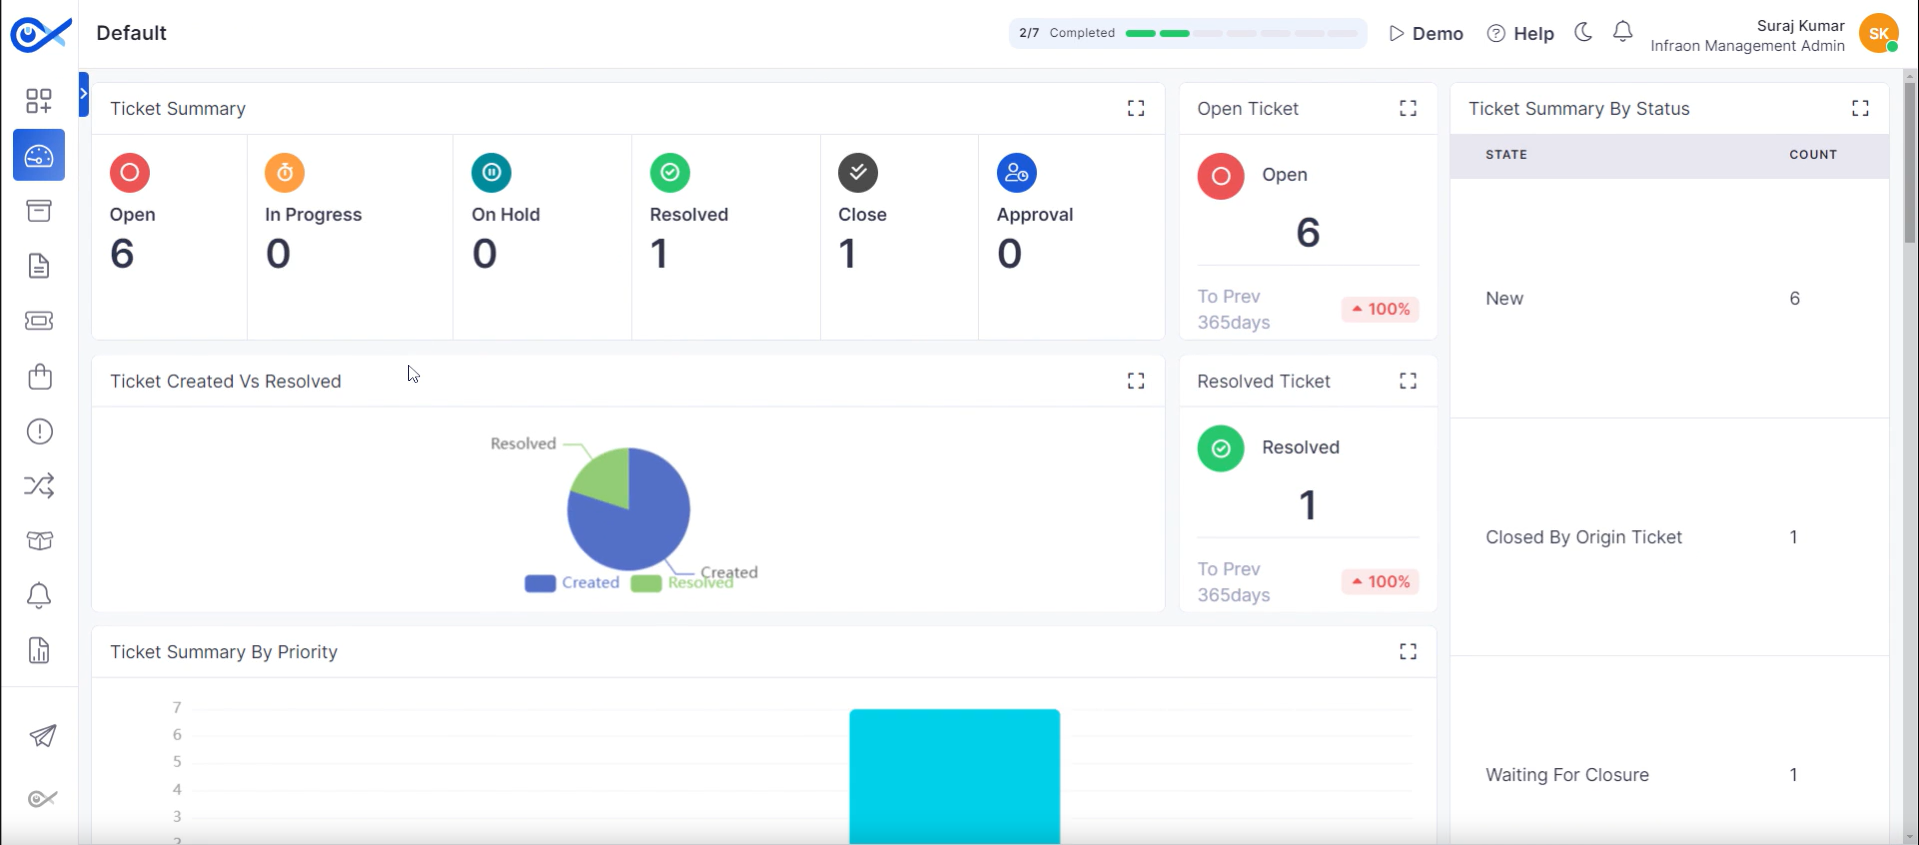
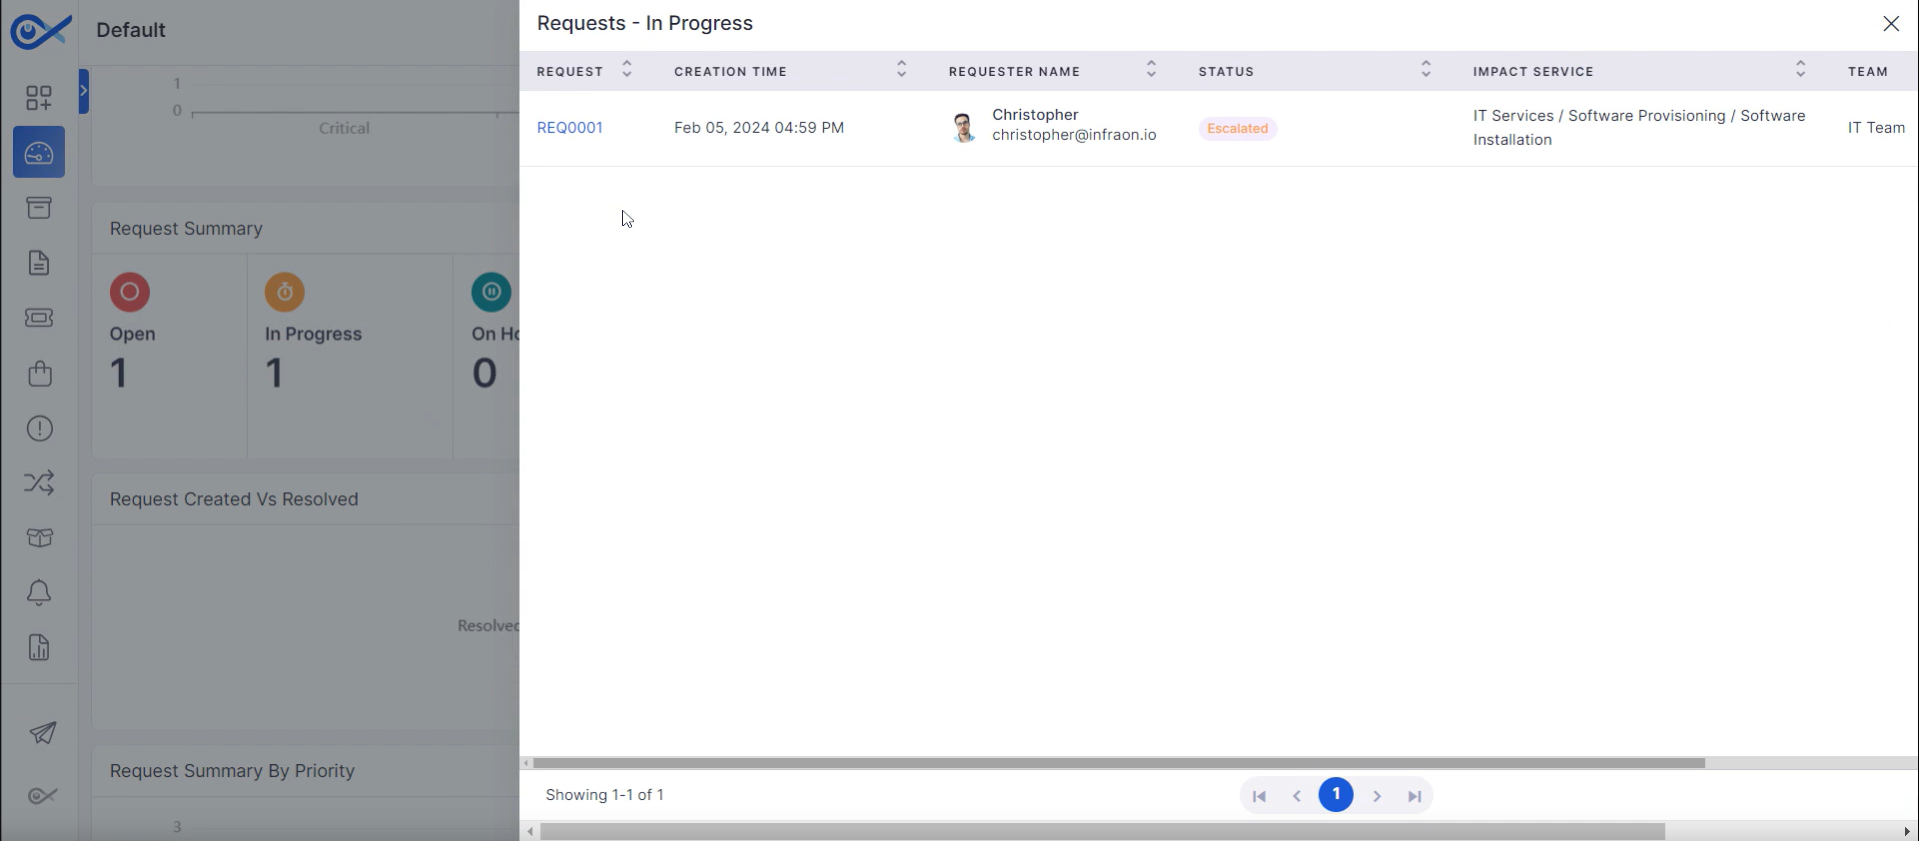
Features pre-built widgets for tickets, requests, problems, and changes.
A decal section displays the ticket status (open, in progress, on hold, resolved, closed, approval).
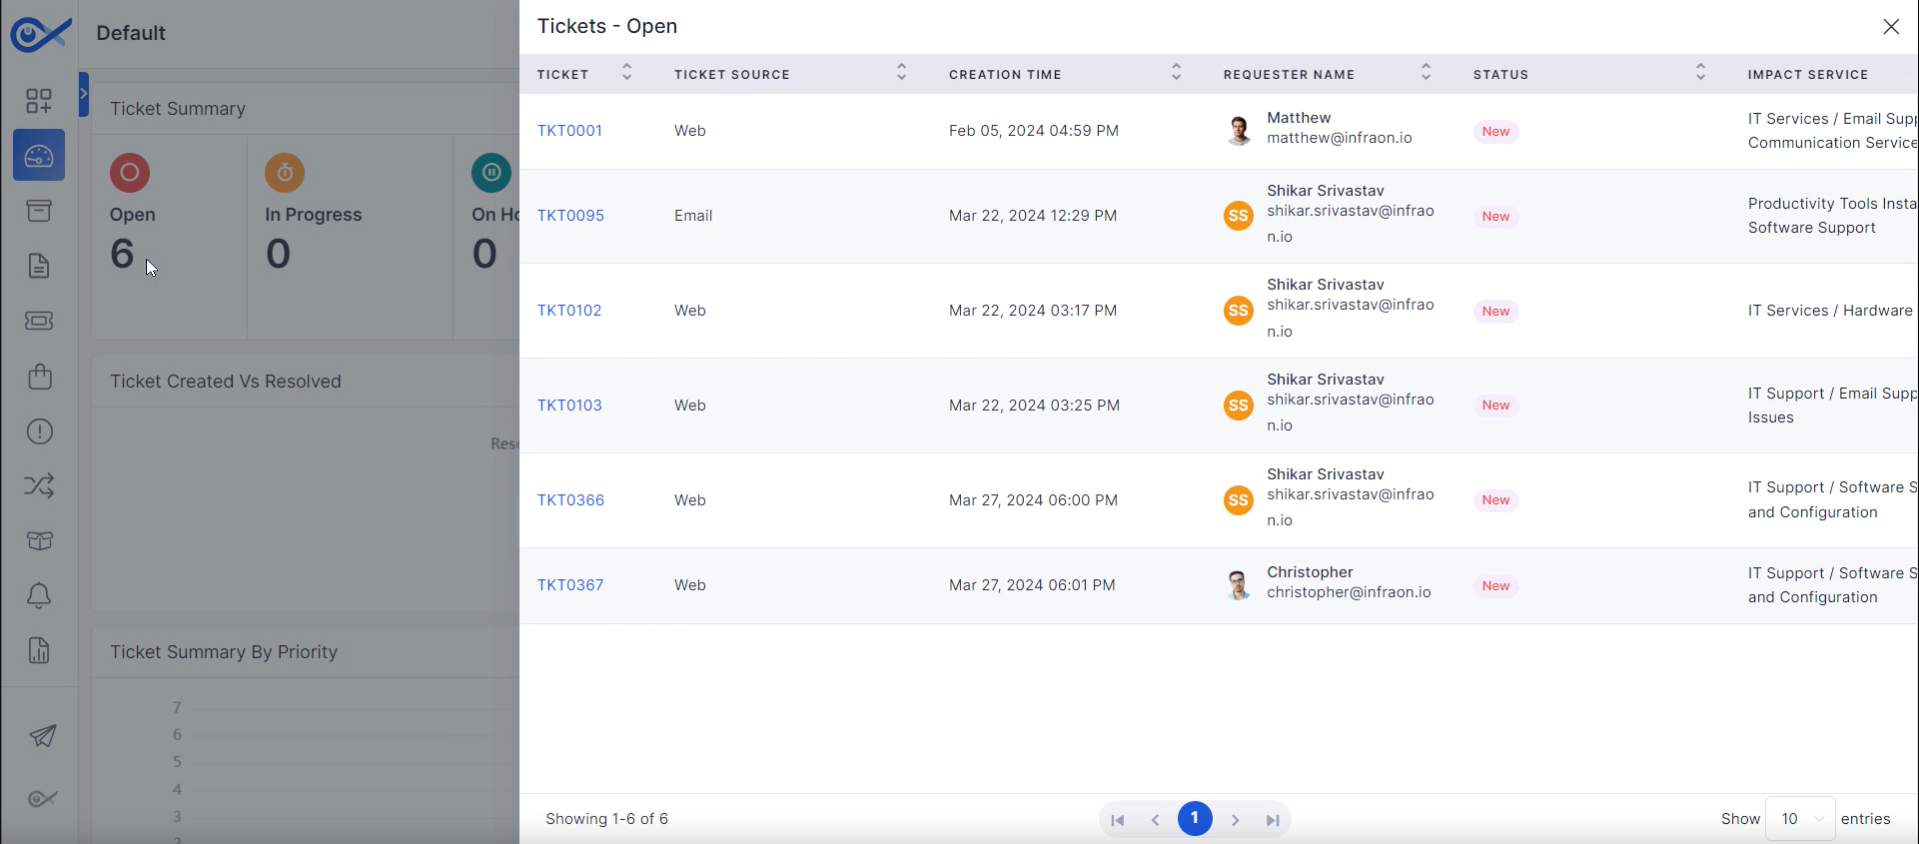
Click on decal widgets to filter tickets and view details.
Explore pie charts for ticket creation to resolution overview.
Analyze ticket priority trends using bar charts.
Interact with requests and problems and change widgets similarly to ticket widgets.
Gain insights into ticket and request volumes and statuses.
Identify trends and patterns in problem and change management.
Utilize dashboard visualizations for quick data analysis.
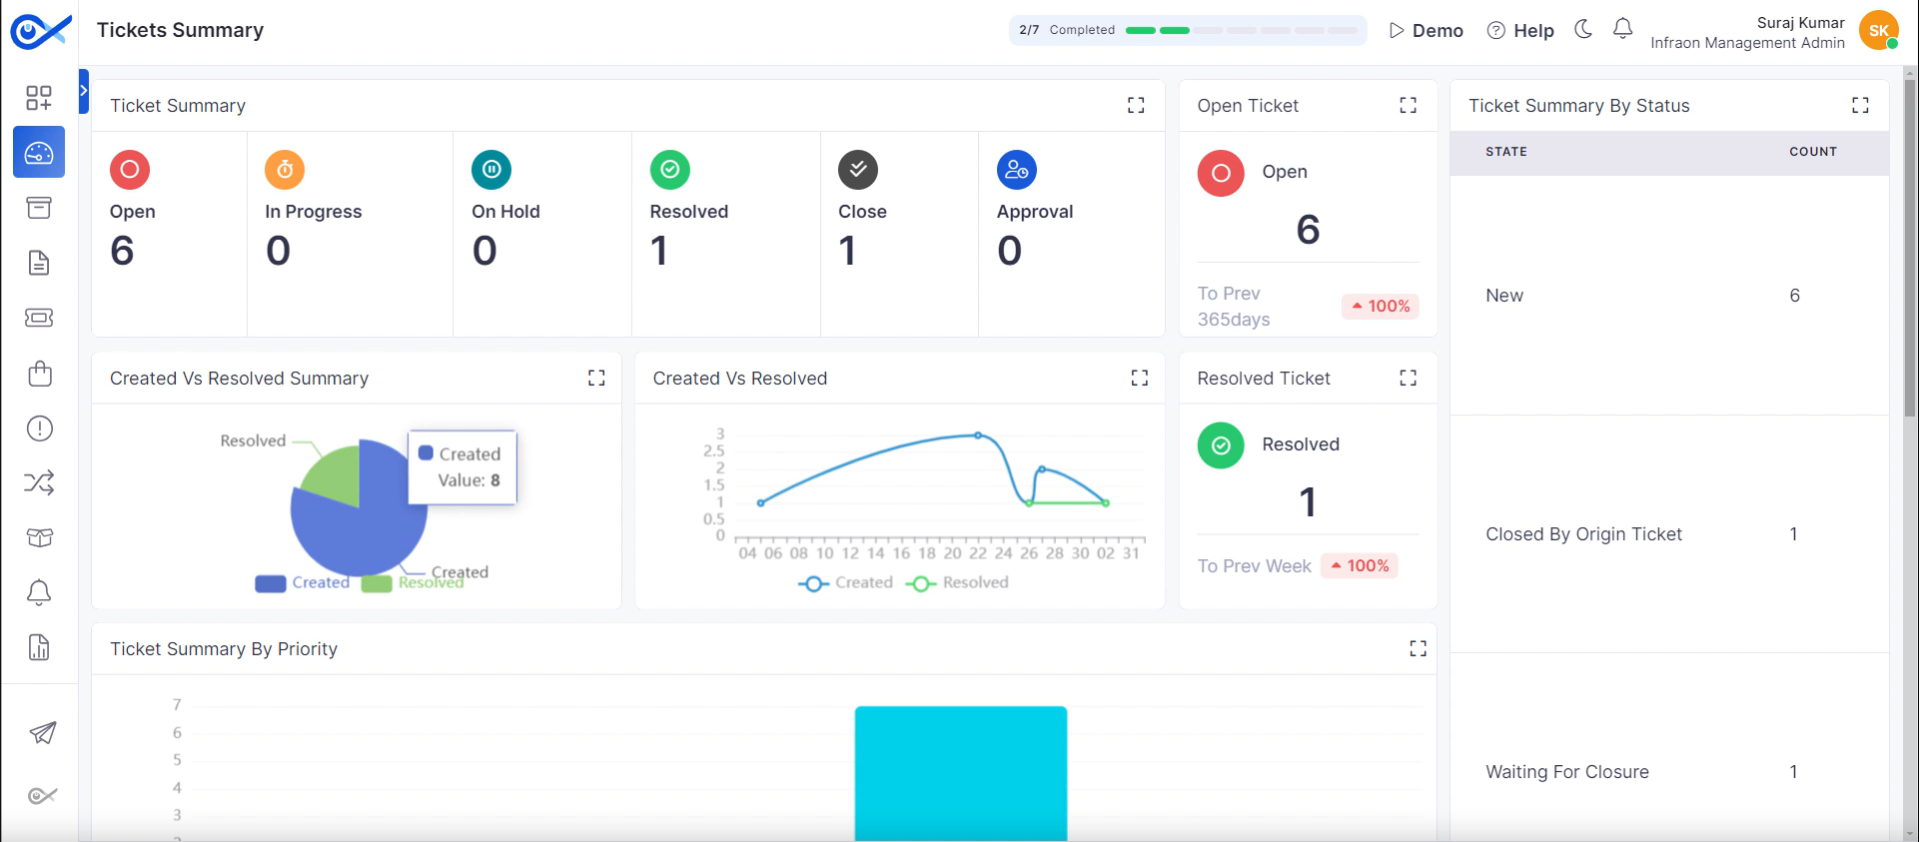
Dedicated dashboard for ticket-related metrics.
Visualizes ticket creation and resolution trends.
Provide ticket status and priority overviews.
Displays ticket creation and resolution comparison.
Presents ticket status summary (open, in progress, resolved, etc.).
Shows ticket distribution by priority.
Utilizes graphs and charts for data representation.
Offers interactive elements for deeper data exploration.
These are the default dashboards available in the Infraon Infinity platform.
This guide will explore the various actions and edit the keys available on the dashboard page in the Infraon Infinity platform. These keys allow for customization and efficient dashboard management.
Click on the blue arrow at the page's top left corner. Hover the mouse over a category to reveal multiple action keys.
The initial key provides functionality to elevate a dashboard to a prominent position within the dashboard hierarchy.
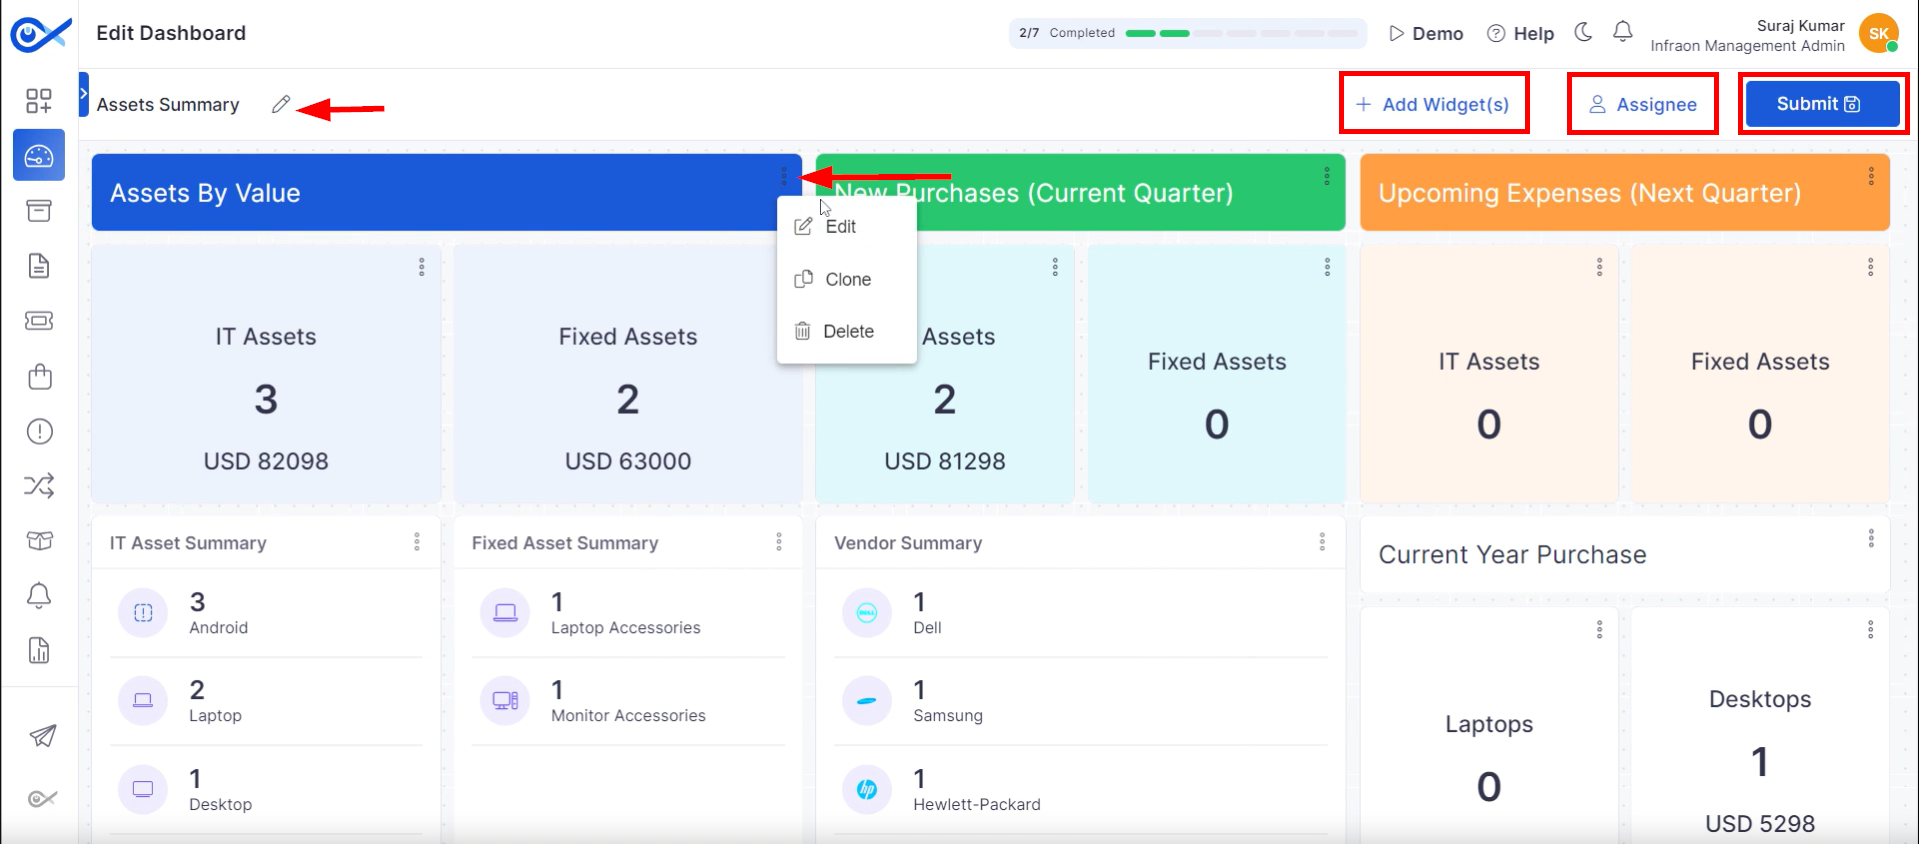
Technical personnel can Edit, Clone, or Delete widgets as required. Additional refinements, such as filter implementation, are permissible. Technicians can modify the background color and apply other configurations contingent upon widget compatibility. To finalize changes, click the “Submit” button.
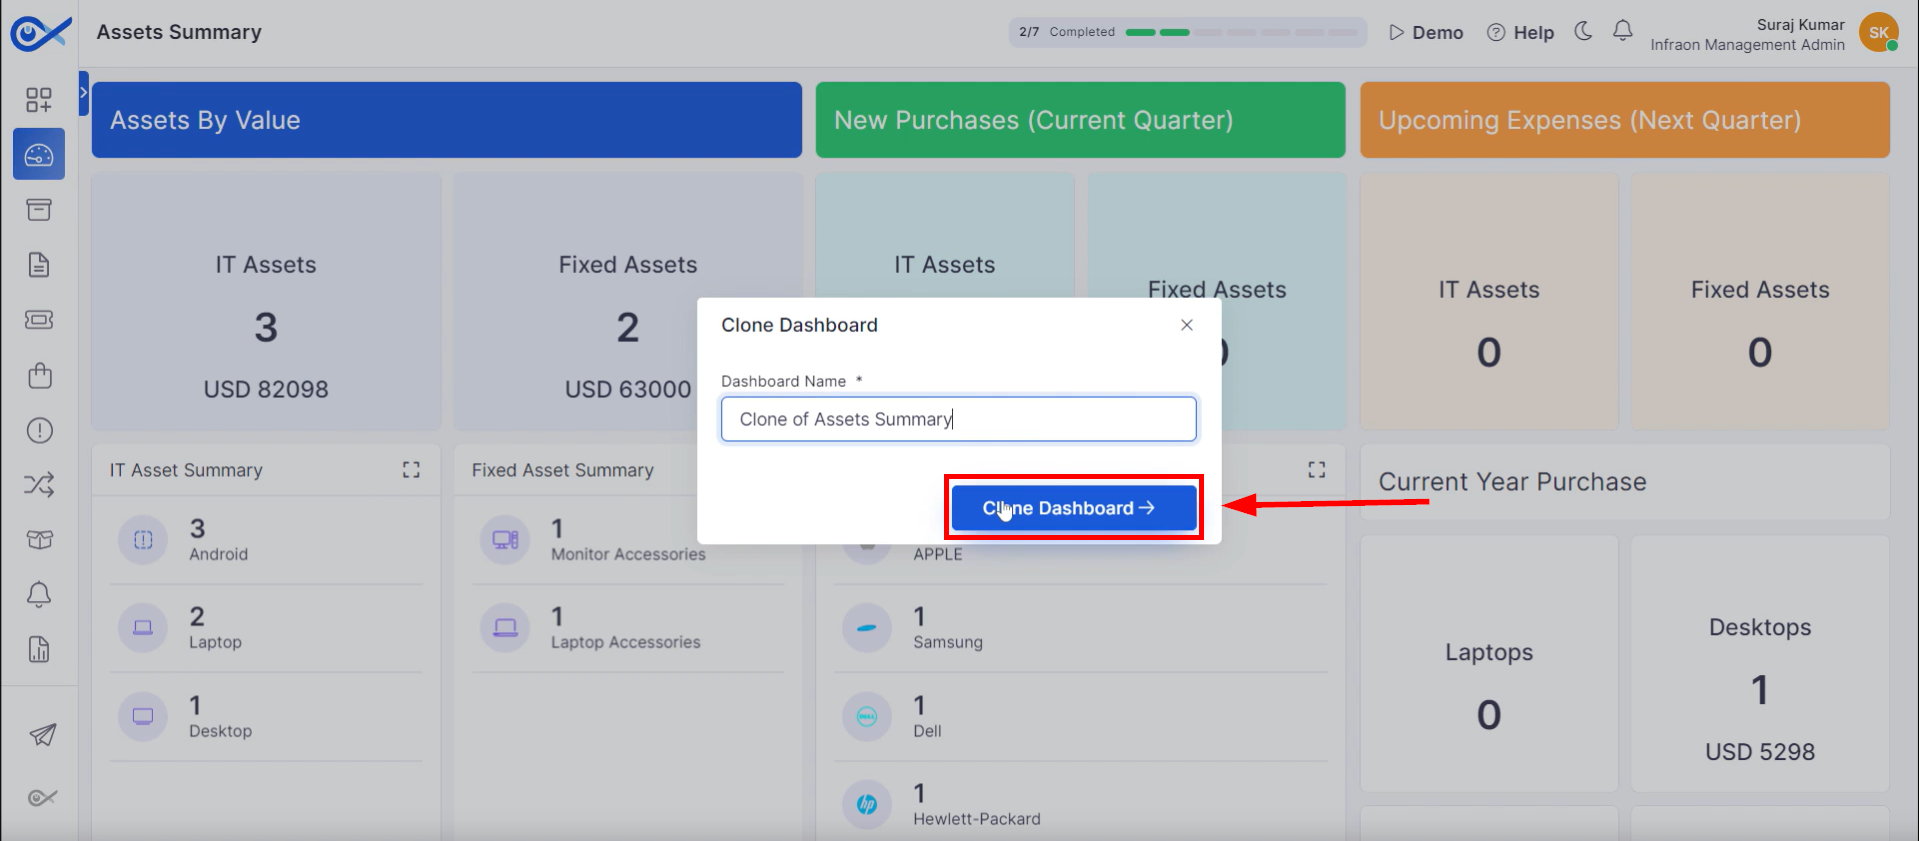
The tertiary action key facilitates dashboard replication through the “Clone Dashboard” function. Upon selection of this option, a new dashboard name must be inputted. The cloning process is initiated by clicking the “Clone Dashboards” button, creating a duplicate dashboard instance.
Utilize the “Delete” function to eliminate a specific dashboard from the dashboard inventory.
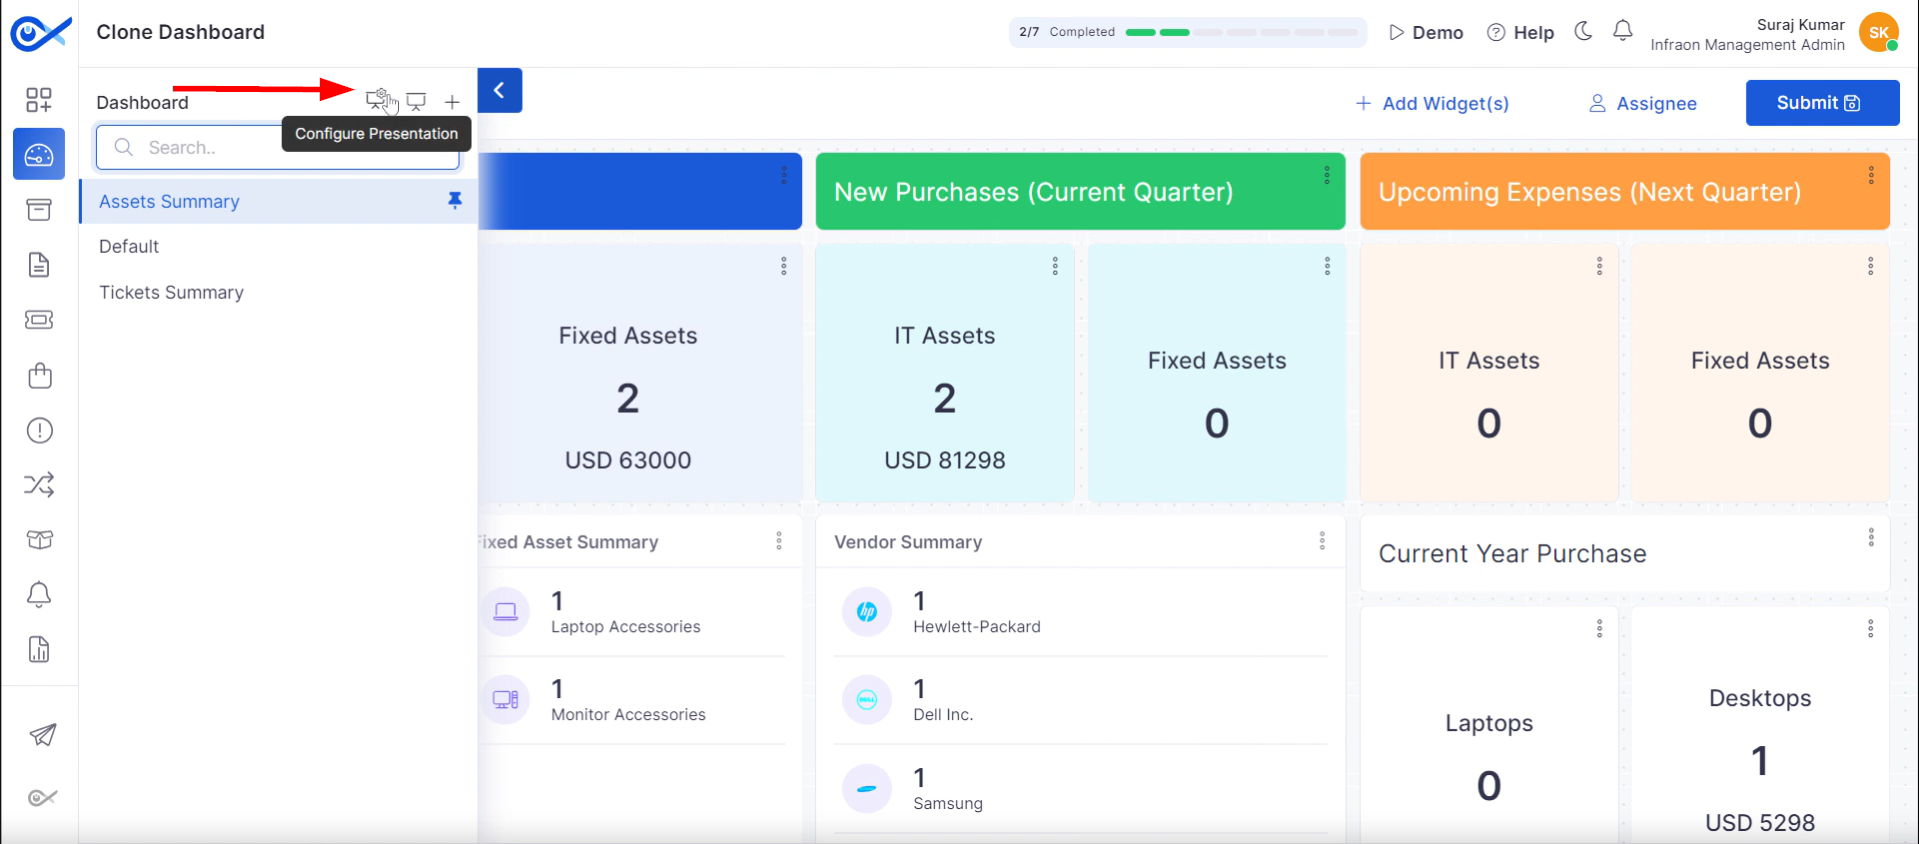
Step 1: Locate the “Configure Presentation” function in the upper left-hand section of the interface.
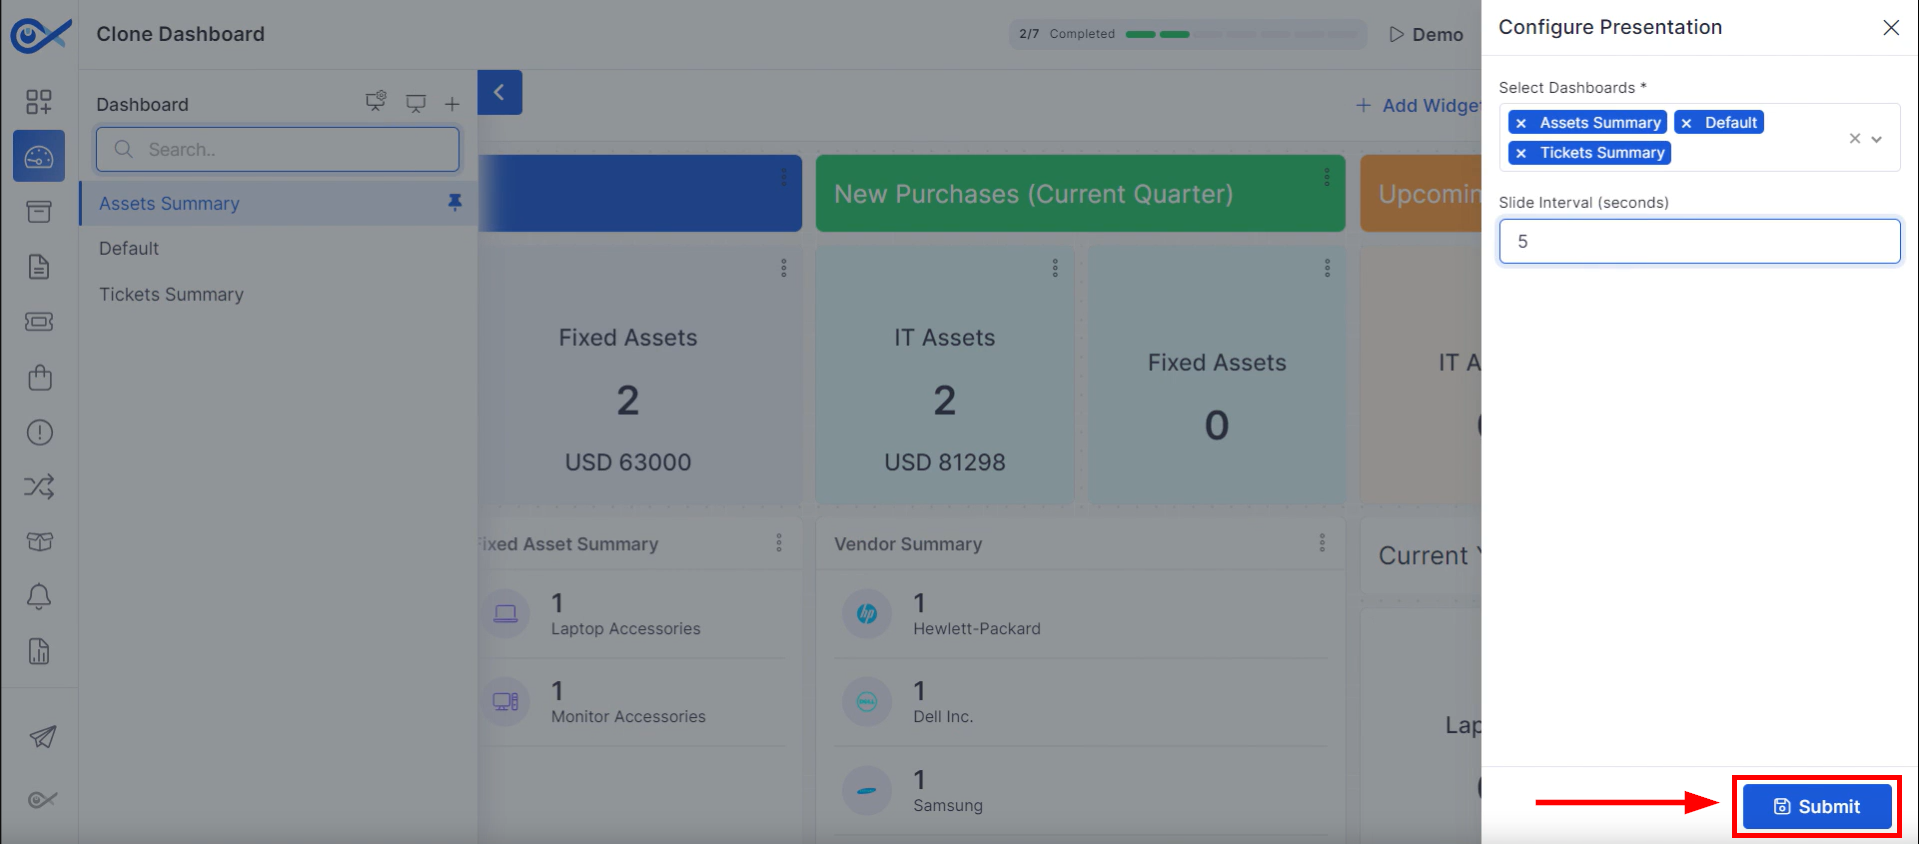
Step 2: A configuration pop-up will open, enabling customization of the dashboard presentation. Choose dashboards for display and set the slide transition time. Apply changes by clicking “Submit.”
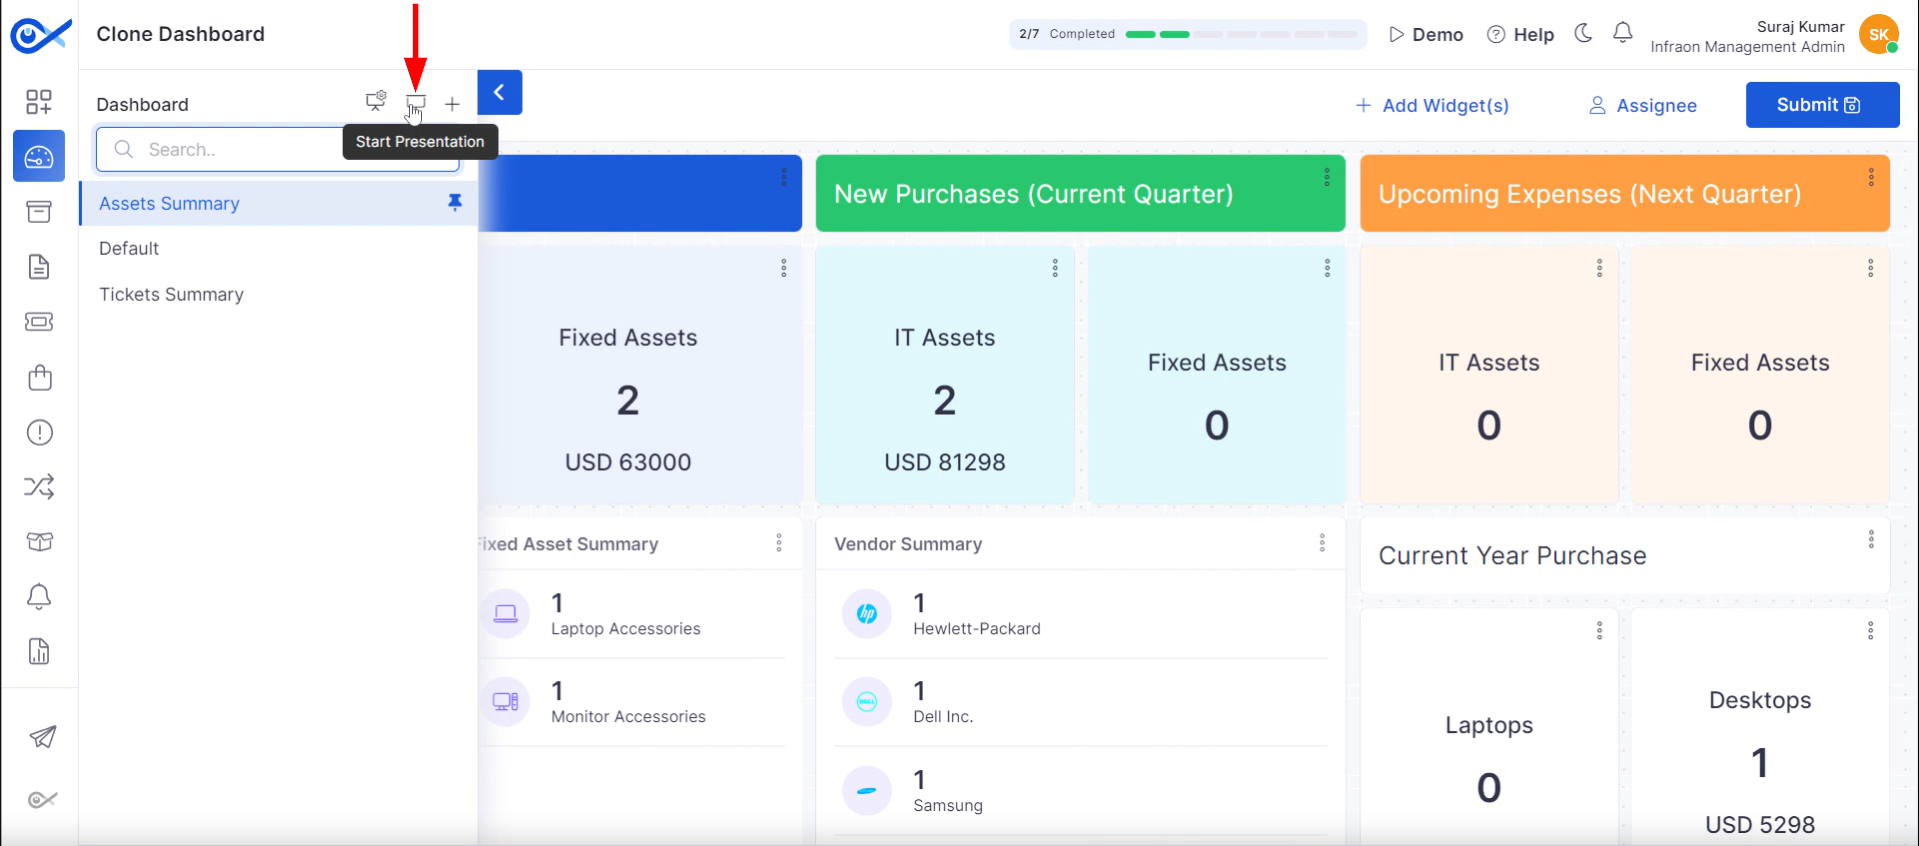
Step 3: Click on Start Presentation to begin showcasing the dashboard.
The dashboard will be displayed in a presentational format.
This guide covers all the miscellaneous icons available on the dashboard page in the Infraon Infinity platform.
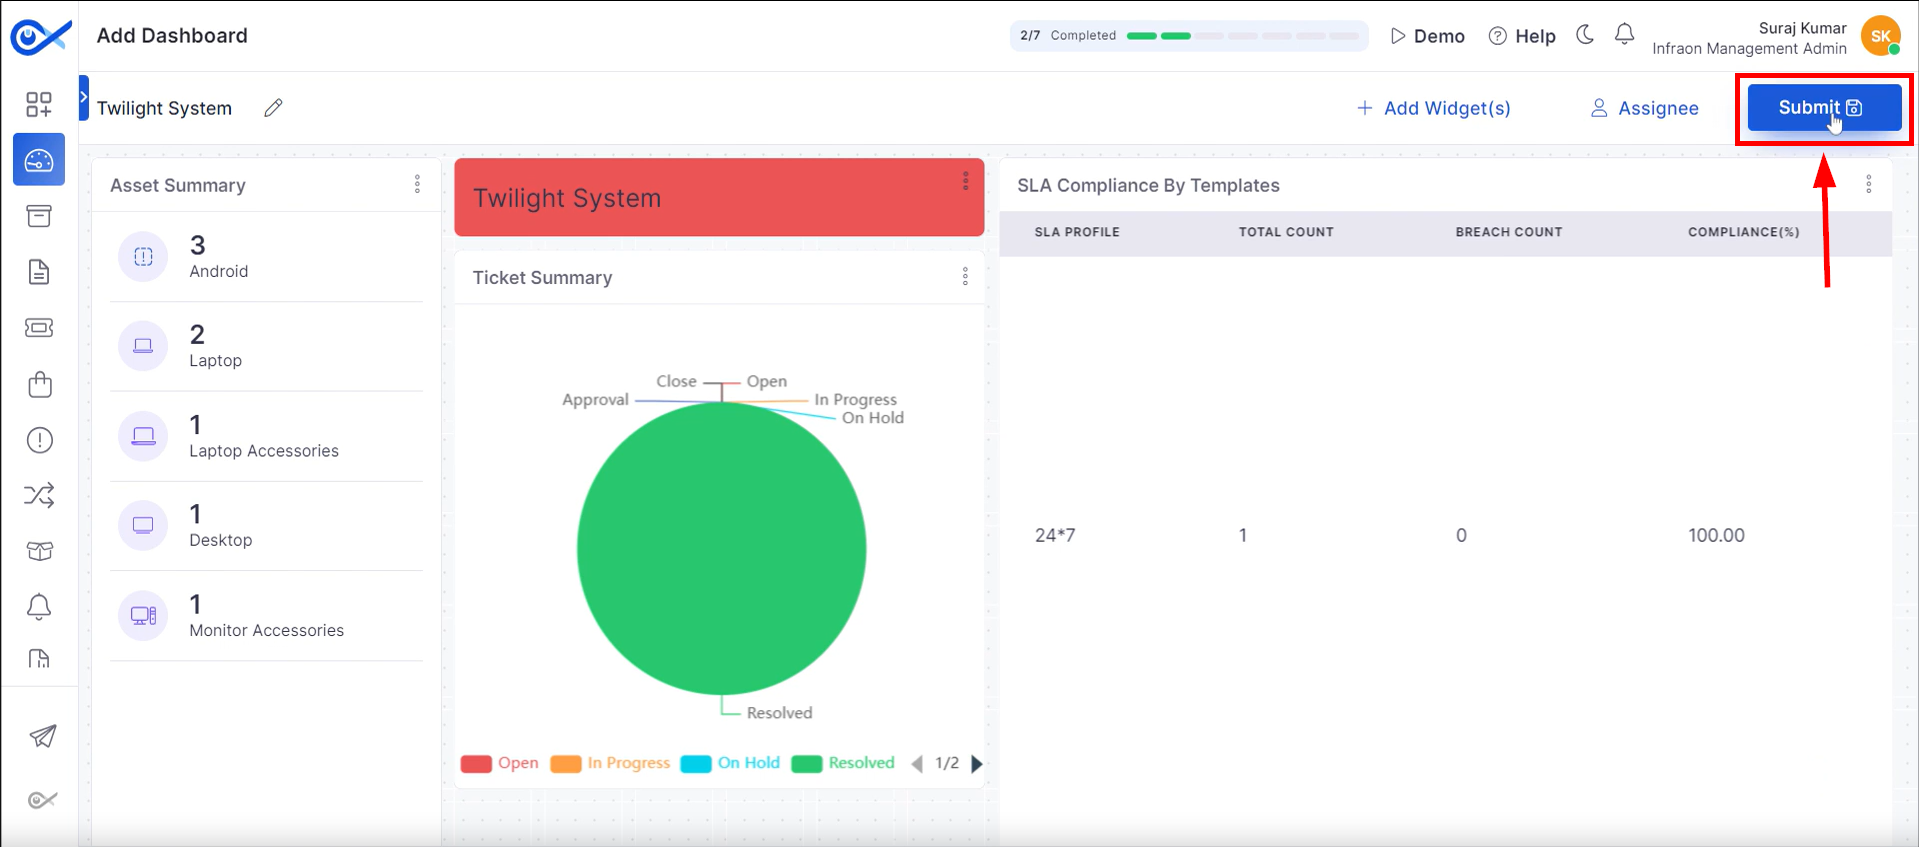
This guide explains creating a personalized dashboard in the Infraon Infinity platform.
Step 1: Click the arrow icon in the top left corner to open the left panel. Then, click the (+) "New Dashboard" icon to create a new dashboard.
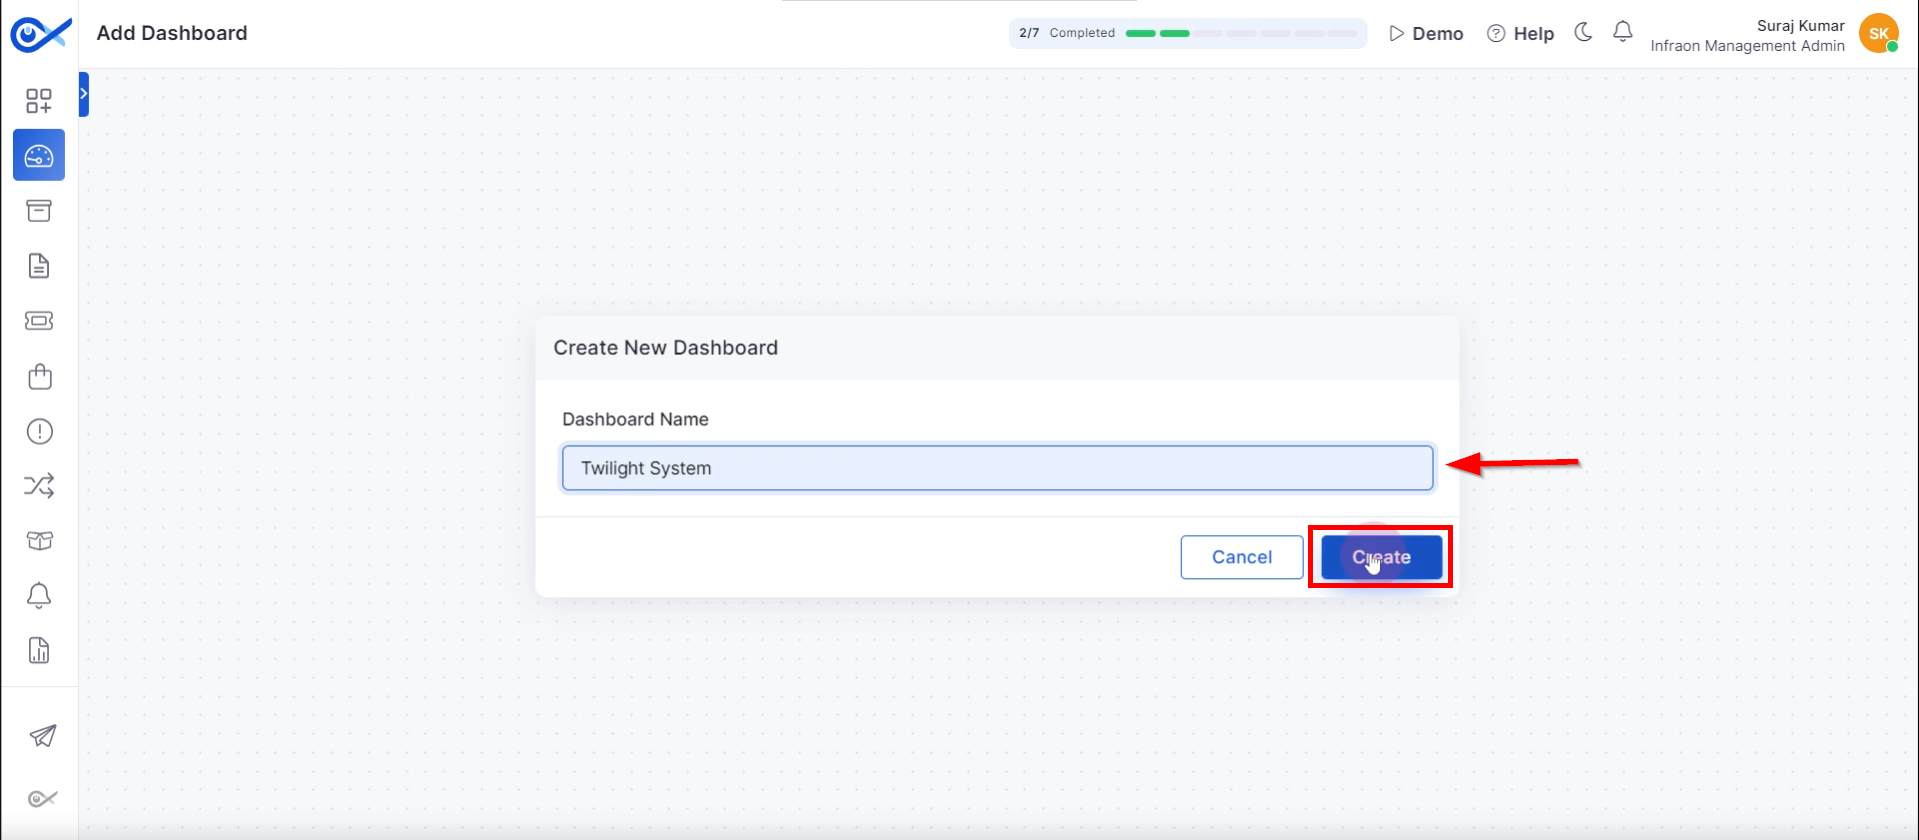
Step 2: Enter a name for the dashboard in the provided field, then click “Create.”
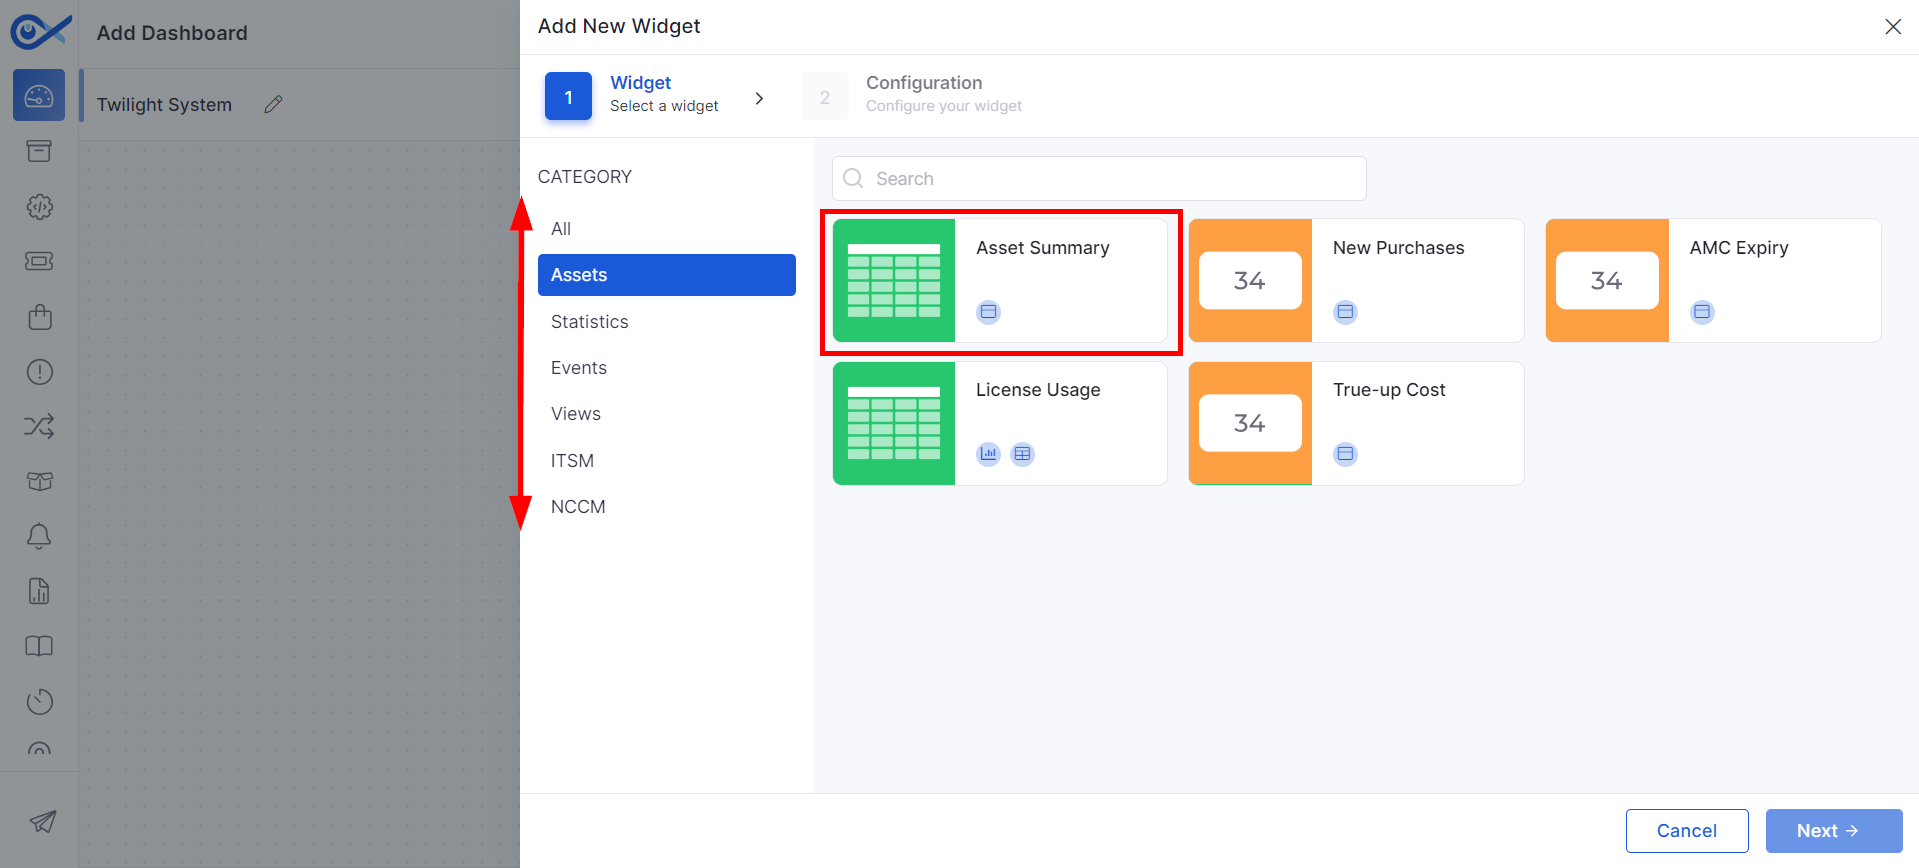
Step 1: A pop-up will appear where technicians can add widgets to personalize their dashboard. Widgets are categorized into Assets, Statistics, Views, ITSM, Contract Management, and NCCM. Select a widget to add.
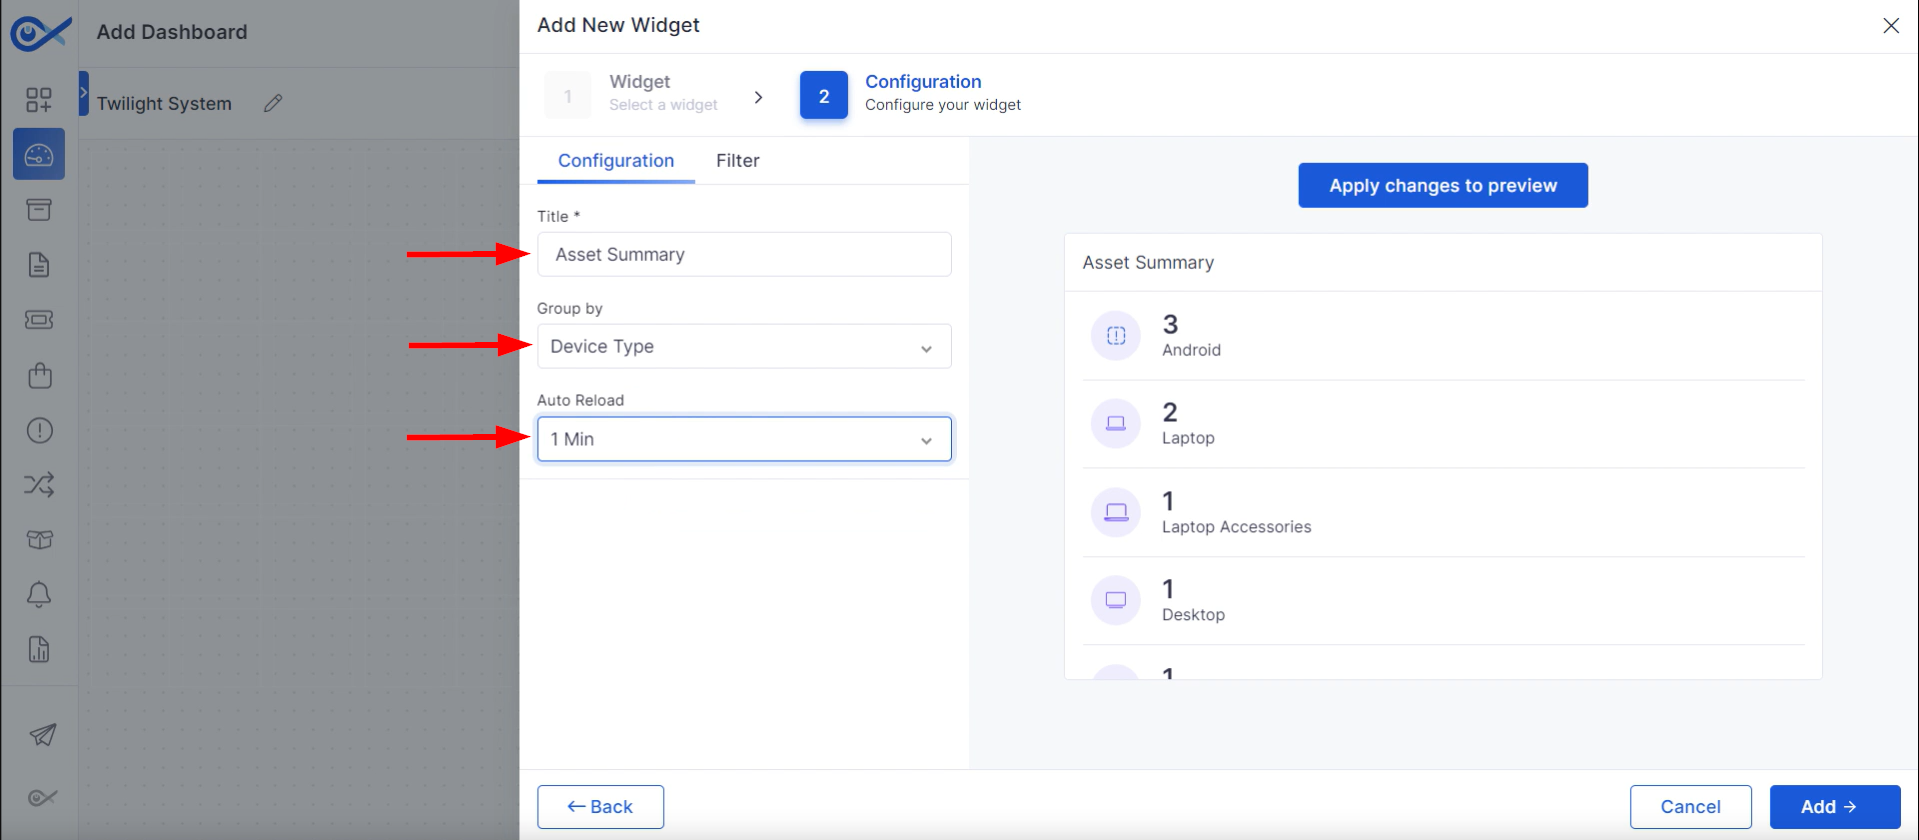
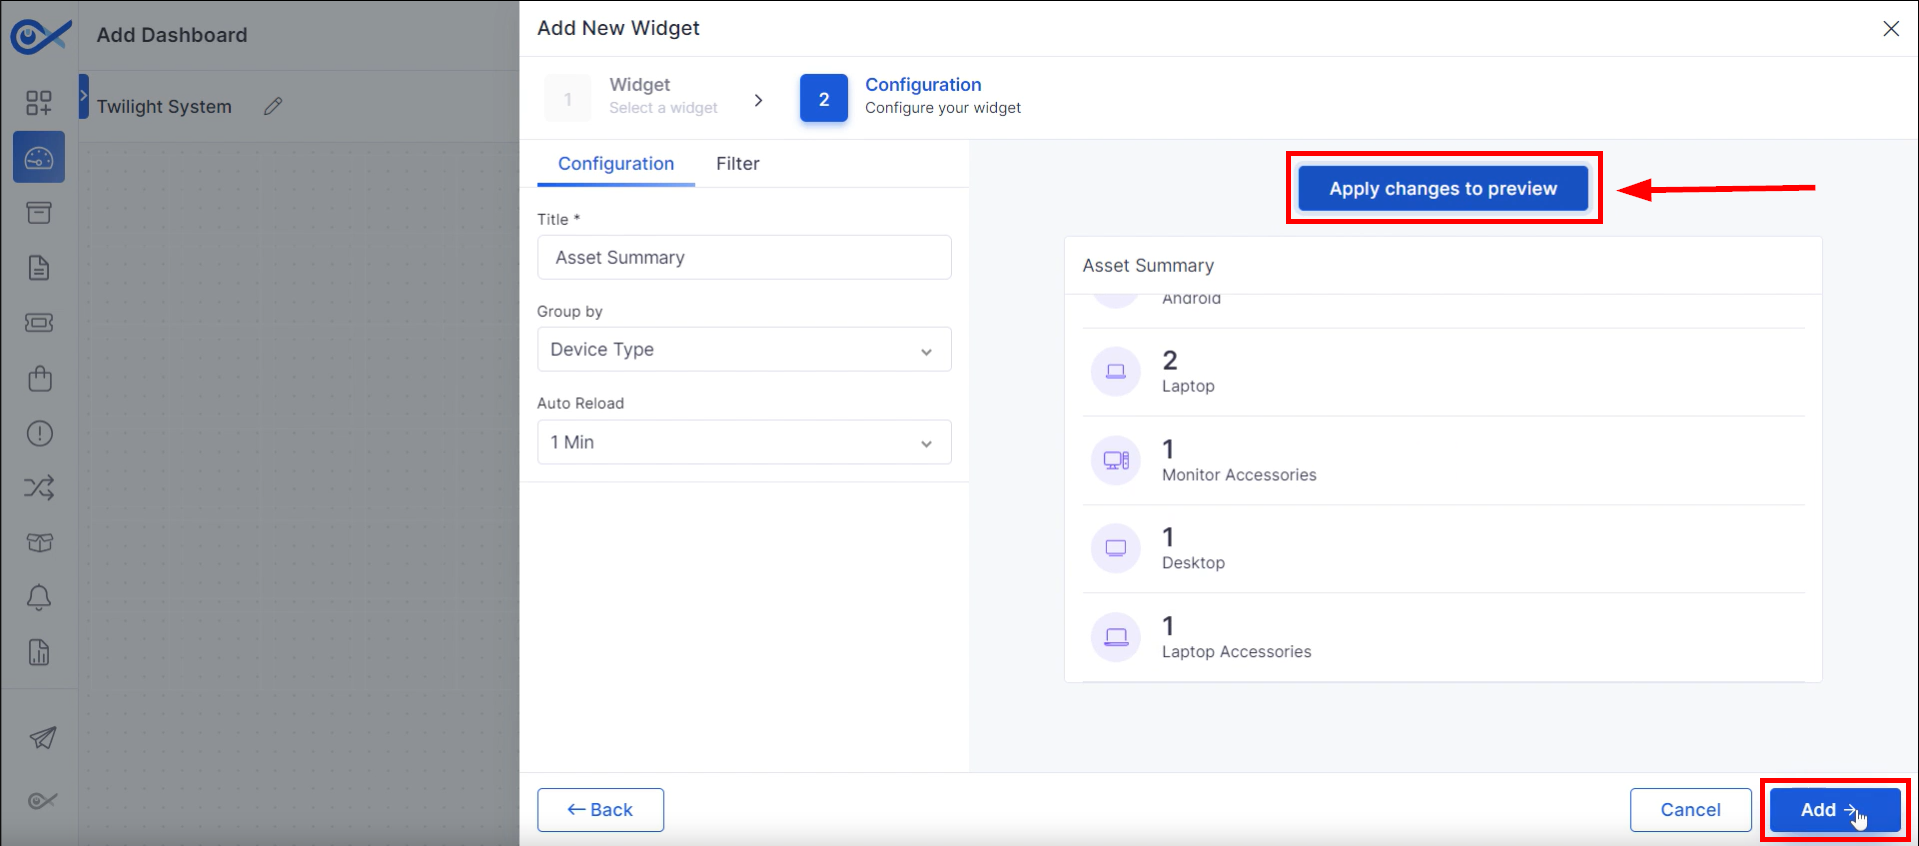
Step 2: Customize each widget by setting its “Title” and choosing a grouping option from the dropdown menu. Select the appropriate “Group By” criteria to categorize the data.
Finally, determine how often you want the dashboard to refresh by setting the “Auto Reload” time.
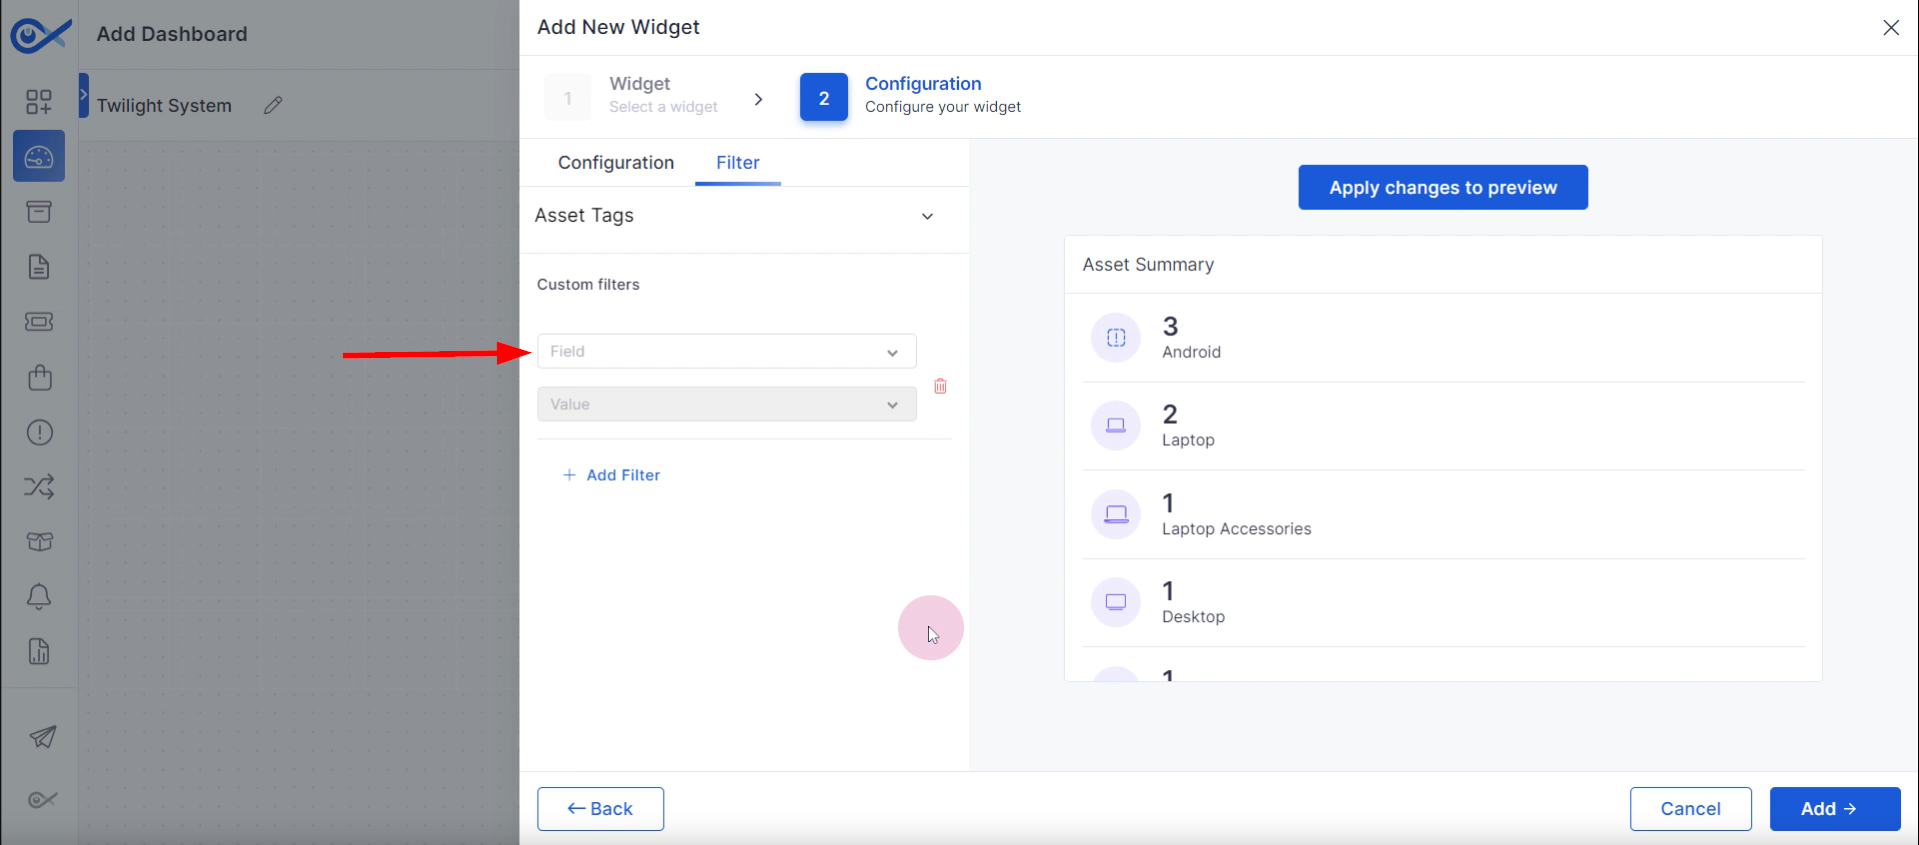
Step 3: To filter the data, click on "Filter." Technicians can then add filters based on asset ID, IP address, or other criteria to control the information displayed. Select the desired filters and apply them.
Step 4: After customizing the required configurations, click “Apply Changes” to view the changes. To include a new widget, click “Add."
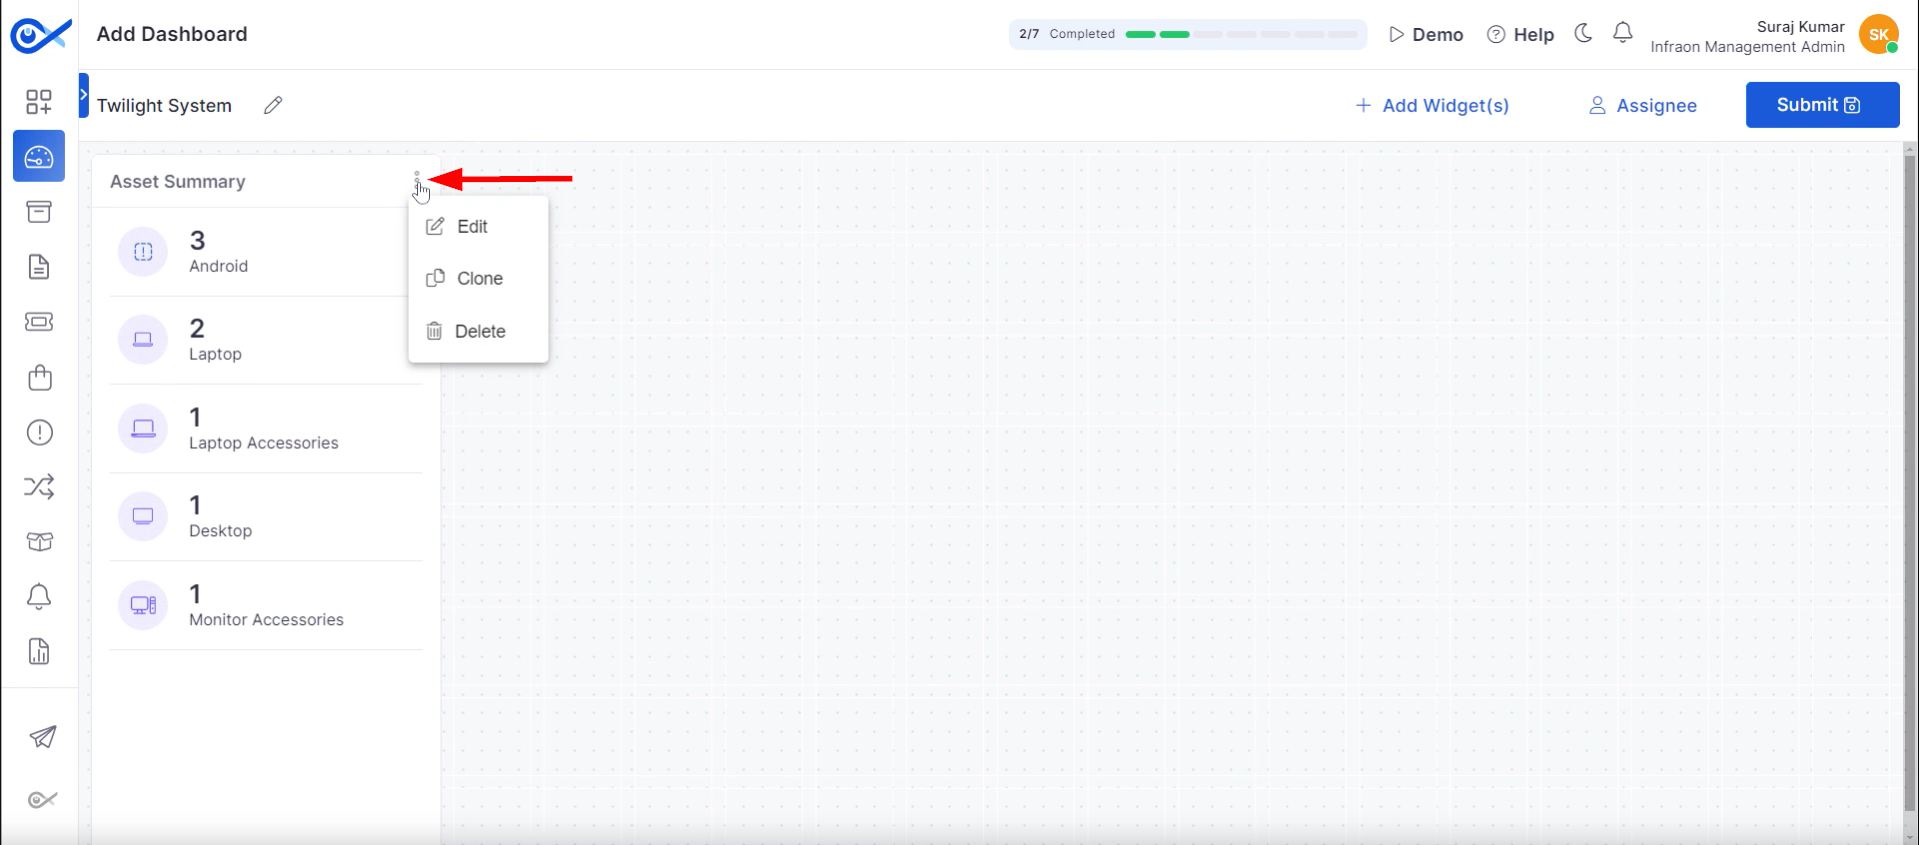
Step 5: To rearrange widgets, drag and drop them on the dashboard. Clicking the “More Options” icon will enable the technicians to edit, copy, or remove a widget.
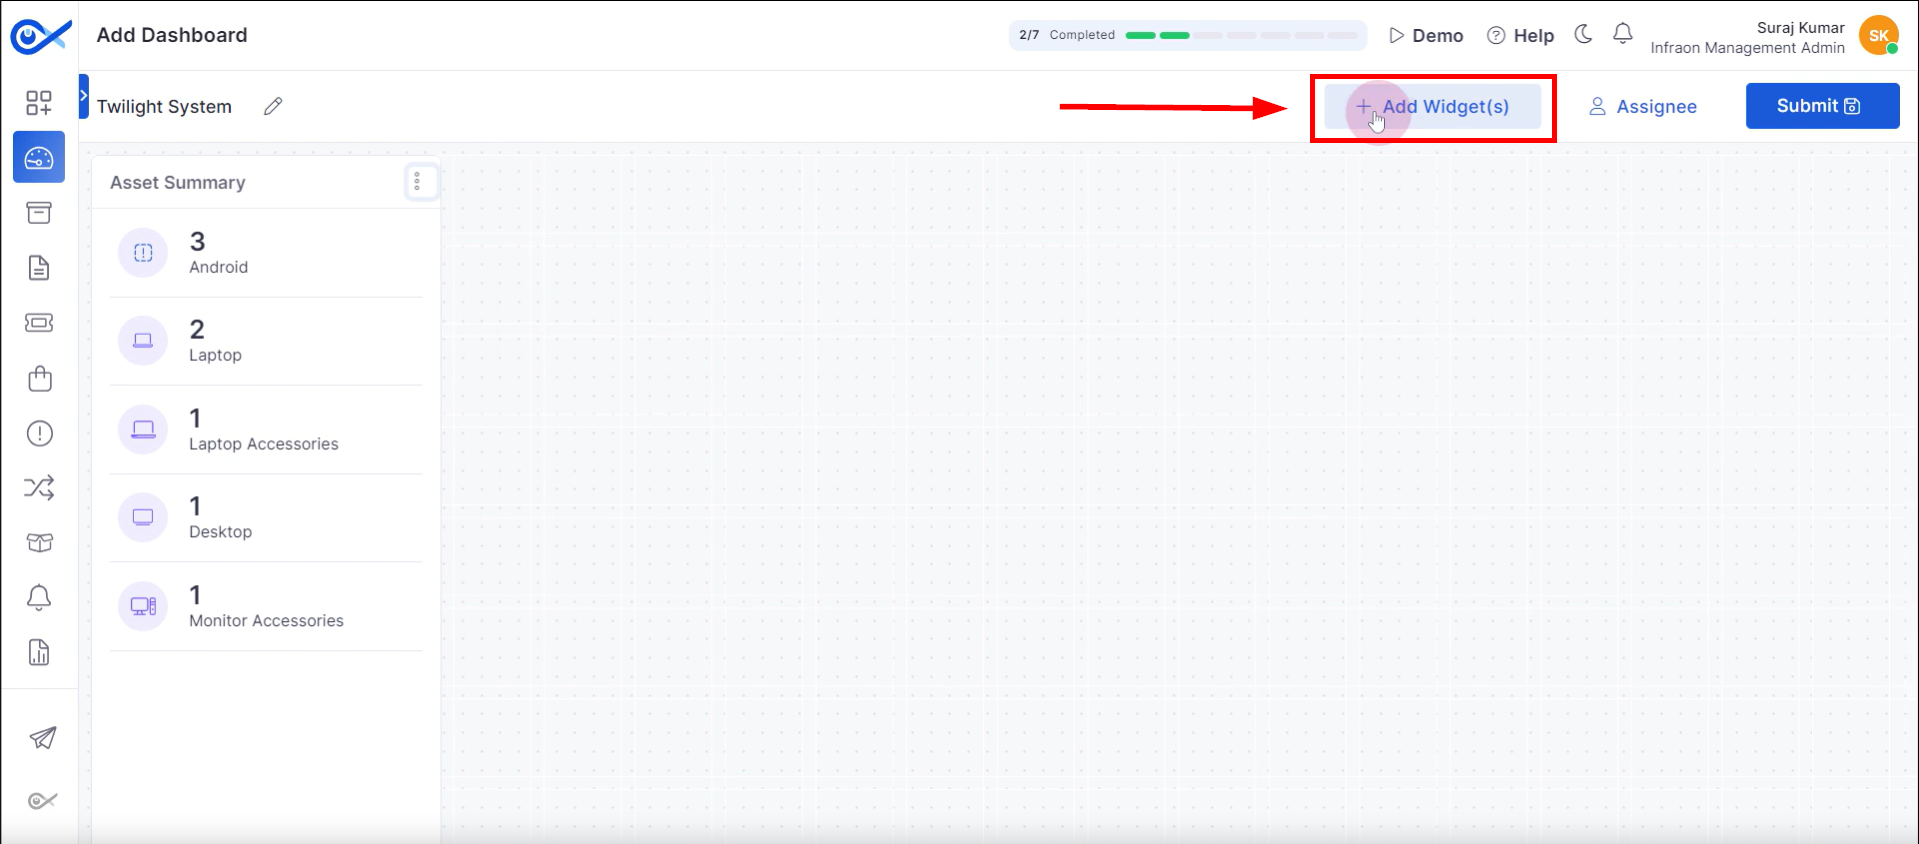
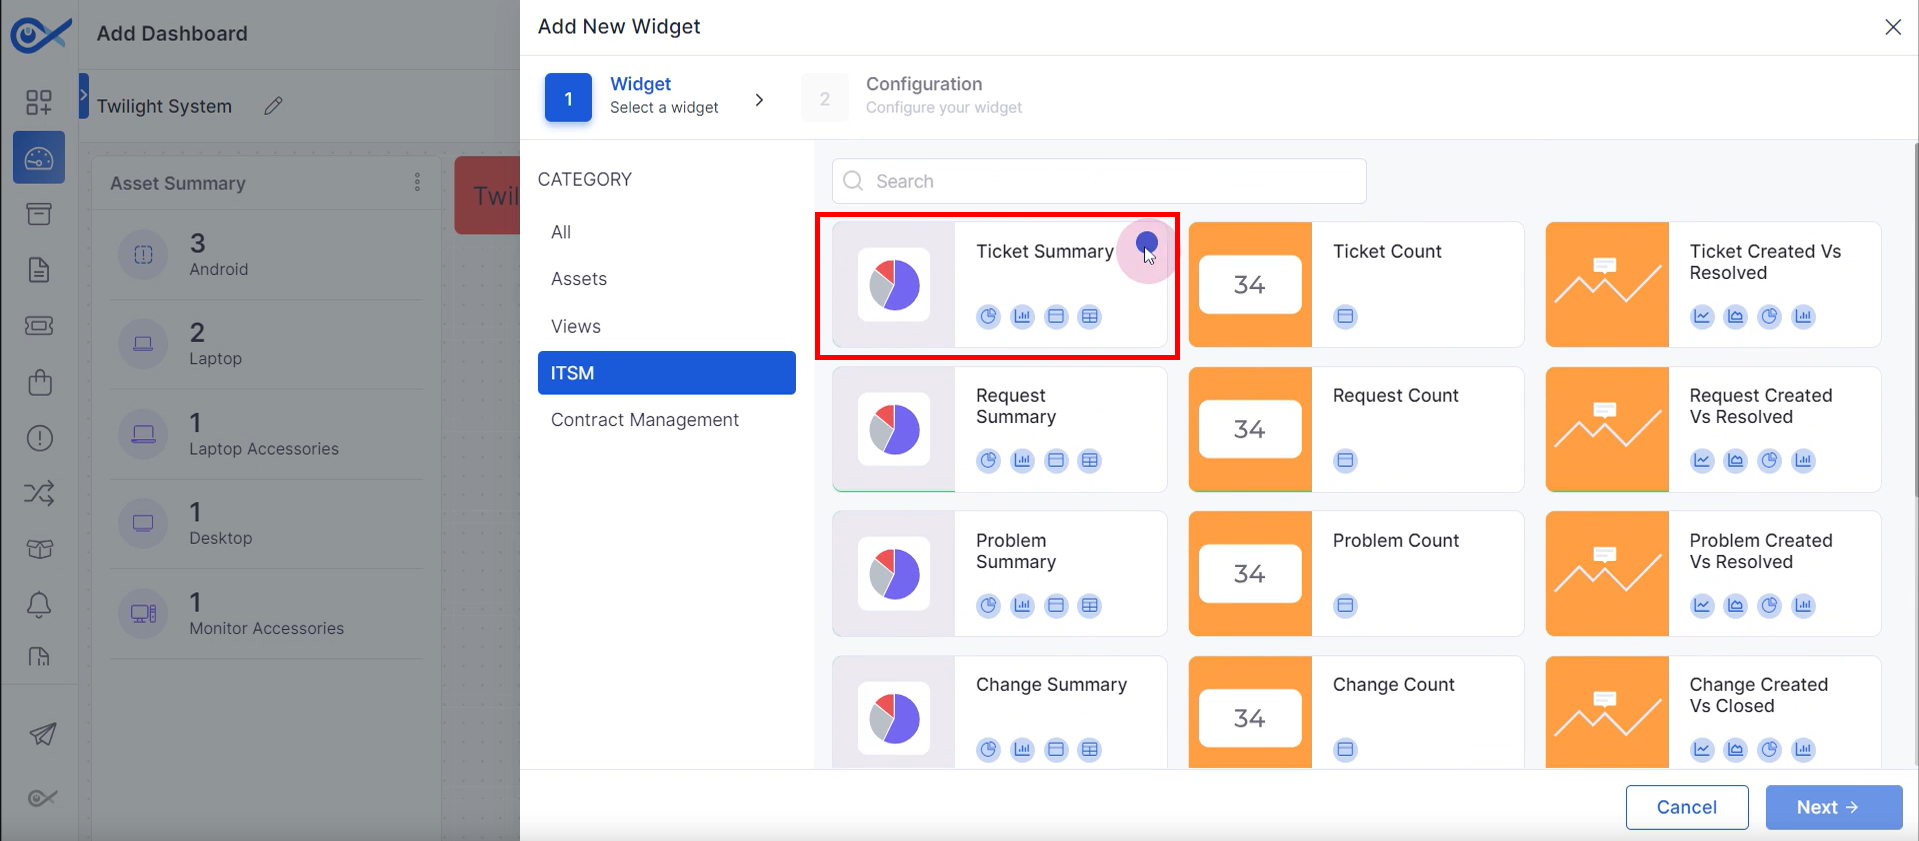
Step 1: Locate the “Add Widget(s)” button on the top panel to add a new widget.
Step 2: The ITSM category offers a range of widgets, including ticket summary, count, and creator-versus-resolved breakdowns. Similar widgets are available for requests, problems, and changes. Select the desired widget to proceed.
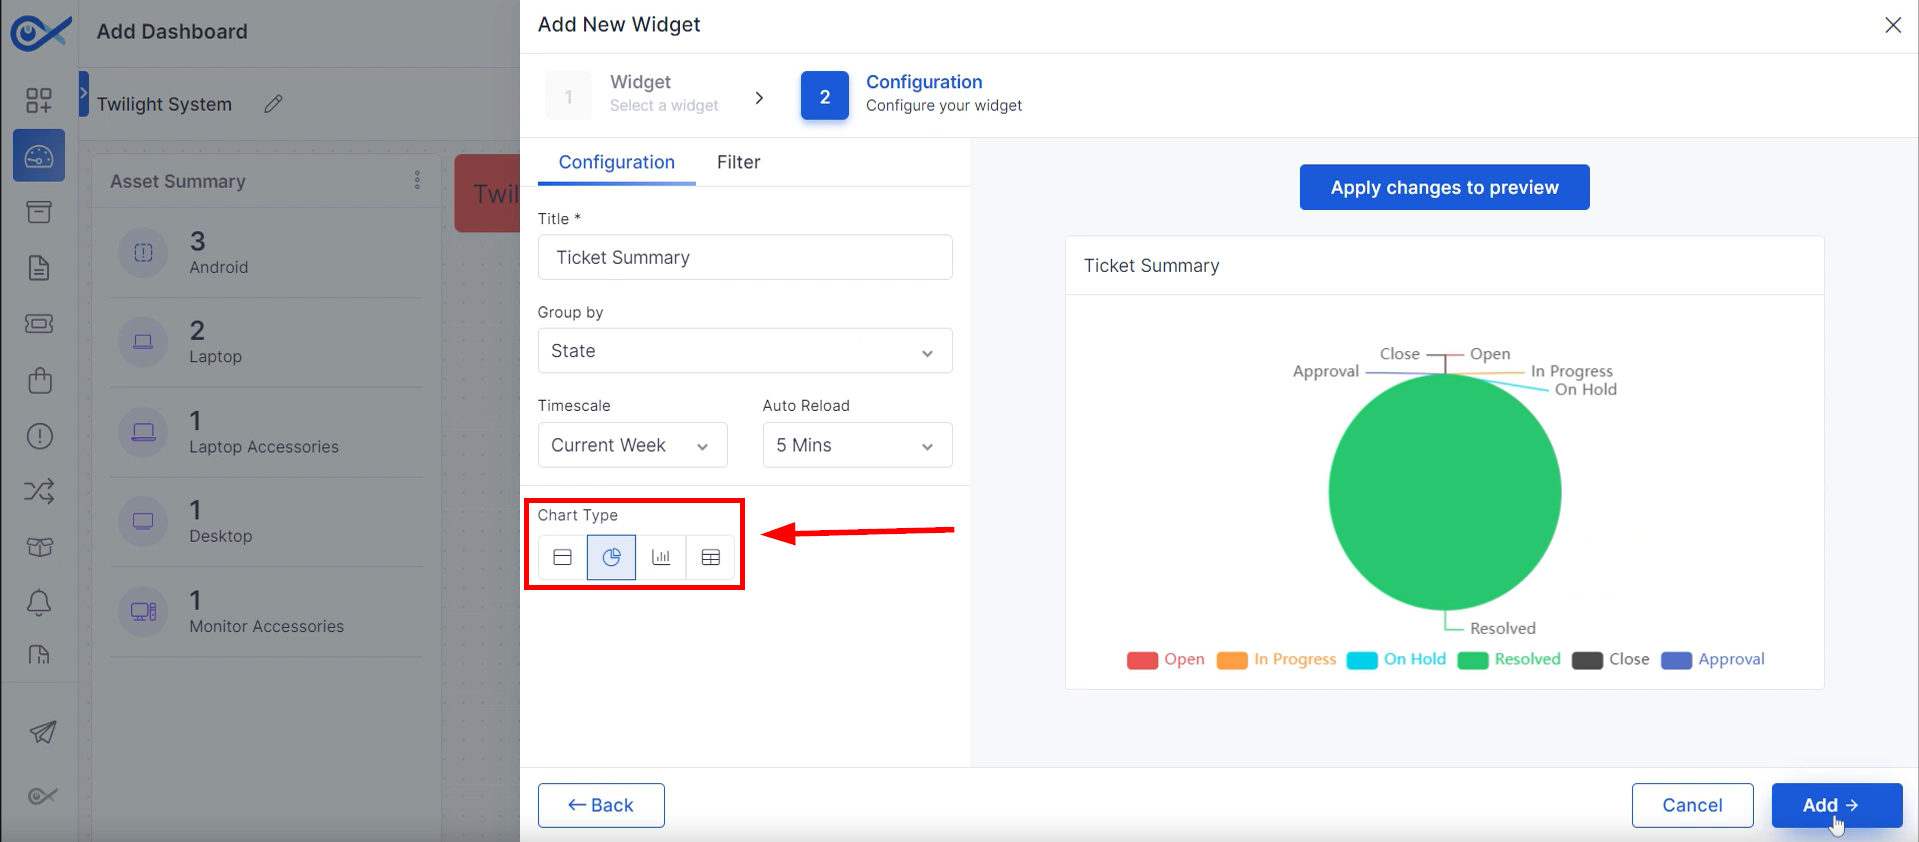
Step 3: Input a “Title” for the widget within the configuration tab and determine the “Group by” parameter from the available options. Use the dedicated “Timescale” configuration panel to filter data based on time.
Step 4: Customize the widget's appearance on the configuration page by selecting from Data Panel, Pie Chart, Bar Chart, or Data Table. Apply the changes to view the preview, then “Add” the widget to the dashboard.
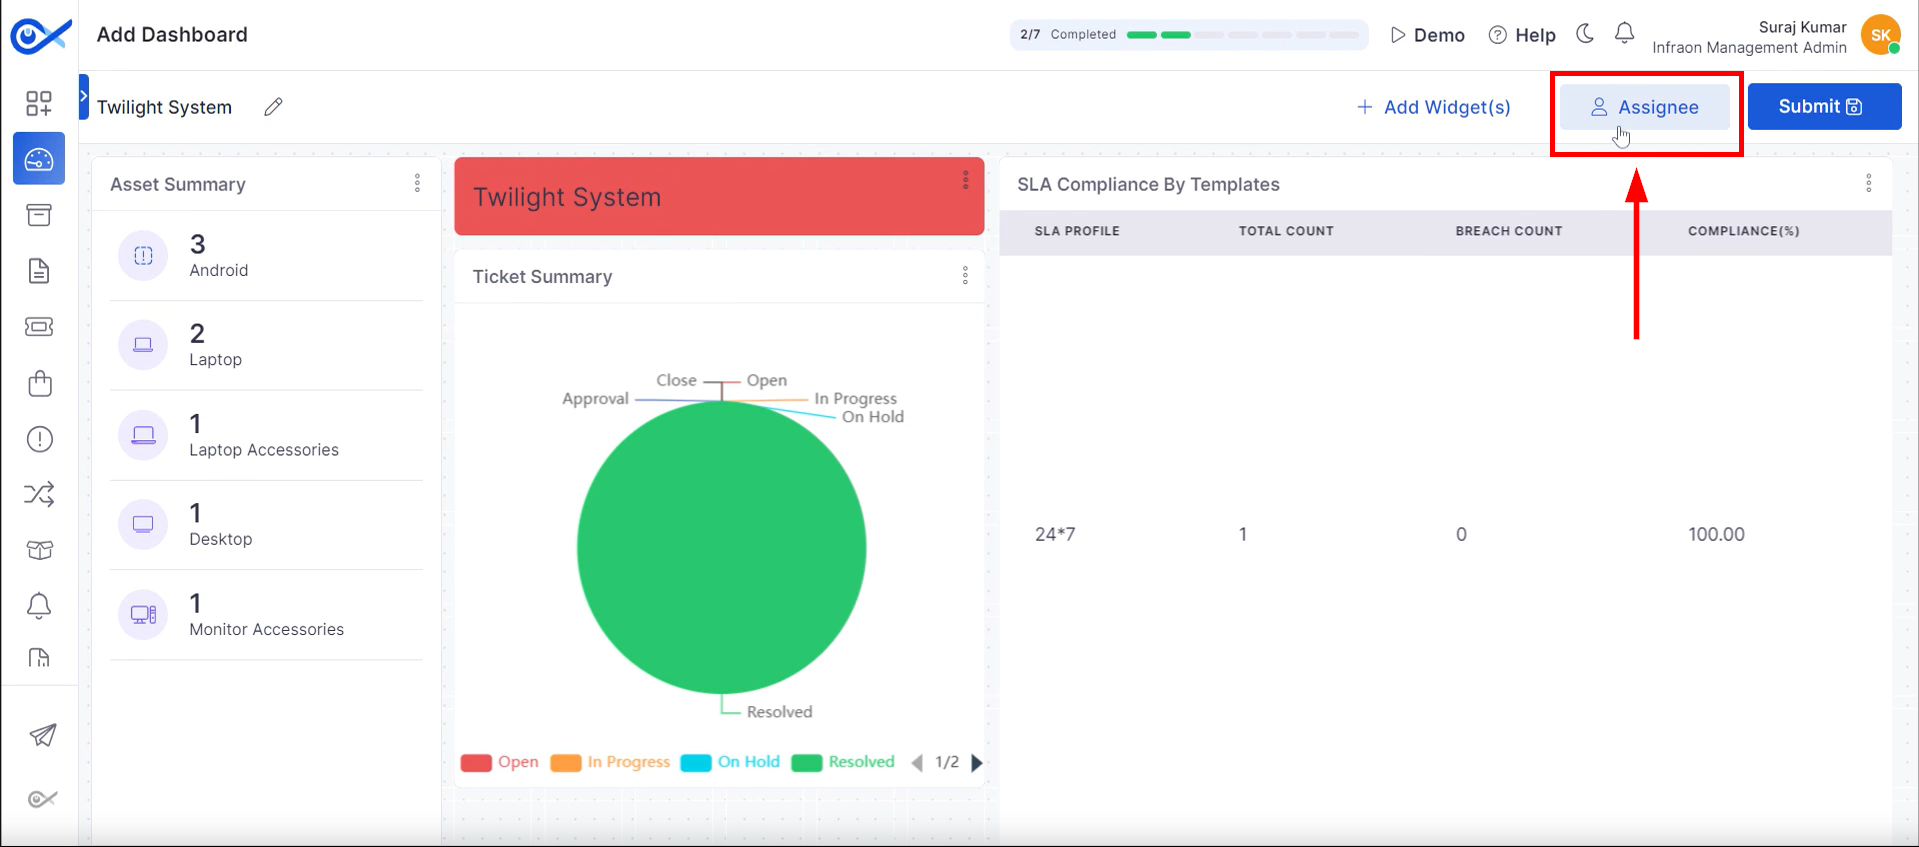
Step 1: To allocate dashboard access privileges to specific users or groups, click on the “Assignee” tab.
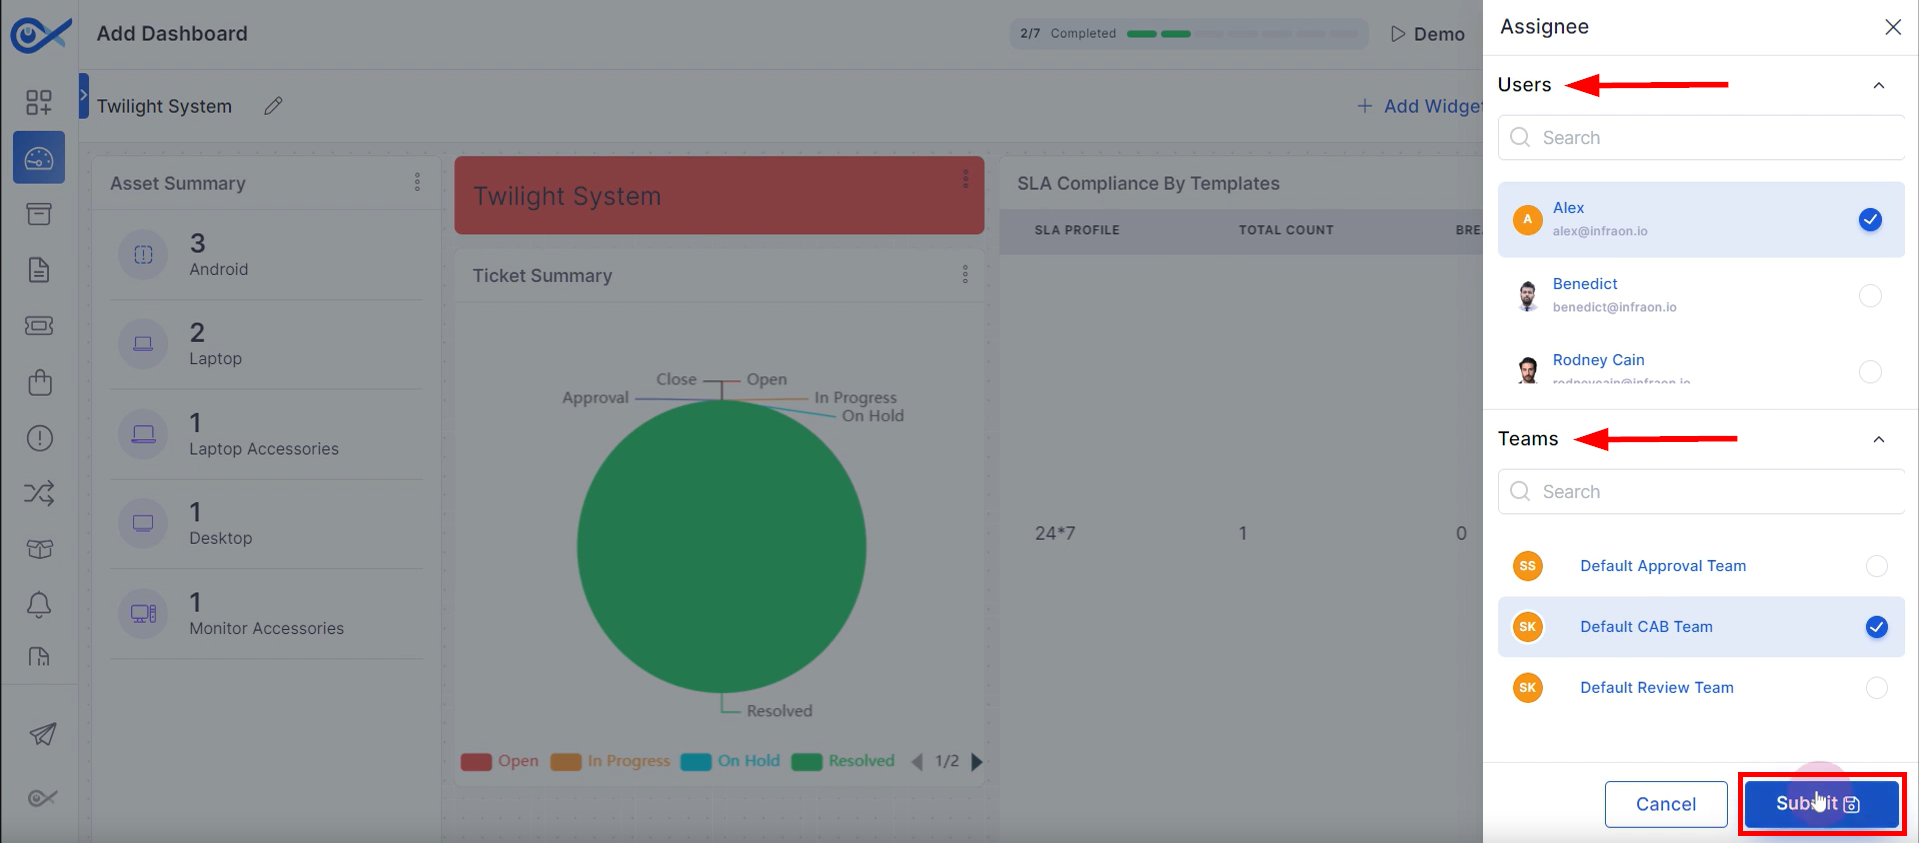
Step 2: Select the desired entities from the available list to specify the target “Users” or “Team” recipients for dashboard access. Upon completion of the assignee selection process, “Submit” the configuration to save the changes and apply the specified permissions.
Once the desired dashboard modifications have been implemented, click “Submit” to finalize and store the updated configuration.
That's how to create a dashboard in the Infraon Infinity platform.